NEWS AND INSIGHTS | INSIGHTS
Market Outlook: Growing Pains
octubre 27, 2026

Economic fundamentals remain strong, but higher yields could weaken prospects for equities.
Recent months have brought a little bit of everything to the markets, from buoyant economic data and strong corporate earnings to fears of reaccelerating inflation and a rapid rise in global yields. The lack of resolution in the Middle East and the run-up to a competitive U.S. election added to uncertainty. Toss in concerns around AI “awareness” and security, and delays in the timing of IPOs for Anthropic and OpenAI, and investors found few places to take cover. Moving forward, we think a key question is how high interest rates can go before they undermine the equity rally; with the global economy seemingly accelerating, the pressure appears unlikely to ease.
Market performance has reflected these shifting narratives. For the third quarter, equities were mixed: After a sell-off in June, U.S. technology stocks strengthened as market breadth fell away, and the S&P 500 closed up 2.3% on strong gains from tech, health care and energy. U.S. small-cap stocks fell as yields rose, losing 7.2%, with much of that loss coming in September. Non-U.S. developed equities rose 0.8%, led by Japan, while emerging markets took a breather, down 0.4%. Bond prices weakened on the quarter, reflecting a rise in global yields; lower-quality floating-rate U.S. debt held up well, while municipals were punished, down more than 6%. Commodities were strong on energy price increases, but industrial metals and agriculture also proved buoyant.1
Whether prescient or based on history, our concern coming out of the second quarter was the potential for interest rates, and real rates (above inflation) in particular, to complicate the investment landscape—and that worry came to fruition. Global yields shot higher over the third quarter as the 10-year Treasury, which started 2026 at around 4%, closed out September just shy of 5.3%—a level not seen since 2002—while the 30-year Treasury finished above 5.6%.2
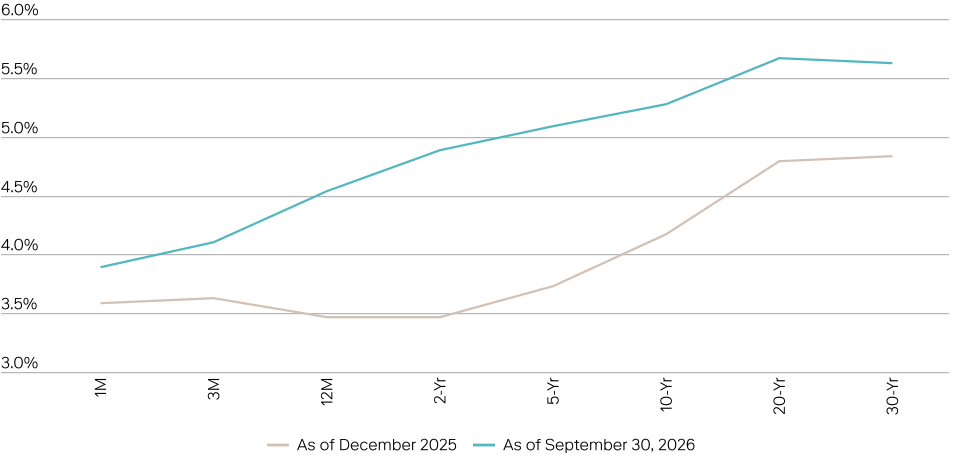
Source: Bloomberg. Data as of September 30, 2026.
These were significant moves in a short period, but through August the equity markets took them in stride. Central bank policy drove the yield increases: The Bank of Japan has been hiking rates since March 2024, while the European Central Bank and the Federal Reserve both joined the party in 2026. The reason for the moves was the renewed prominence of inflation, even as fears of rising unemployment due to AI disruption failed to materialize. More challenging for markets, however, was the prospect that higher policy rates could undermine business fundamentals and the relative value of equities versus bonds.
Complicating the environment has been a disconnect in how rates have moved around economic data releases and central bank announcements, with longer yields becoming less correlated to expectations for short-term interest rates (which, cumulatively, are supposed to determine long-rate pricing). It appears that bond markets are pricing in higher real rates that anticipate accelerating global growth. (The OECD forecasts that the U.S. economy could expand by 2.2% in 2026 and 2.1% in 2027, while the Fed sees a rosier picture for next year, with GDP expected to increase by 2.4%.3)
Historically, the average U.S. hiking cycle has produced an increase of over 3% in the fed funds rate, which has led to a higher cost of capital and pressure on equity valuations, not to mention margins and earnings.4 Yet expectations today are generally for a 0.5% to 1.0% total increase in the fed funds rate (we’ve seen 0.25% so far)5 and for equities to perform well through the end of the year and into the first half of 2027.
AI has been catalyzing growth and is producing a different set of economic consequences than we have seen since the buildout of Chinese infrastructure in the early 2000s. Wages are not being pressured higher and, in fact, are moderating, while non-human resources such as power infrastructure and memory are demanding prices higher than even a year ago. The baskets used by central banks to measure inflation are dominated by costs borne by the end consumer, and while we believe they will eventually be passed through, AI is at this juncture an enterprise story, not a consumer one.
As such, central bank efforts to hinder growth through a typical “demand shock” may prove to only accelerate the organic moderation already occurring in areas such as shelter and services, and do little to slow broader growth and the targeted areas of inflation associated with that growth.
In short, rates have been moving higher, and in our mind represent a meaningful threat to the ongoing rally in stocks—although perhaps not the biggest one.
AI is everywhere we look, and fueling U.S. economic growth. Capital expenditure and, in turn, the overall capital intensity of the global economy, have grown exponentially. In the U.S., the AI buildout now accounts for more than 10% of GDP. Much of this has concentrated in large tech companies, with benefits evident from their second-quarter earnings reports: Cloud revenue at Amazon, Microsoft and Alphabet accelerated at its fastest pace in years, as businesses across their ecosystems invested in building out their AI capabilities.6
Despite some broadening away from the “Magnificent 7,” strong performance has magnified the concentration that was evident coming into the current boom. Ten companies represent almost 40% of the S&P 500 by market capitalization, and of these, only Berkshire Hathaway is not a direct AI player.7 Earnings, too, reflect such dominance, with AI-related companies potentially delivering close to 50% of all S&P 500 earnings growth in 2026.8
The risk is not just concentration. The sharp increase in debt issuance by hyperscalers reflects the increased capital intensity of these businesses; the magnitude of the borrowing is not only creating higher debt loads for the companies themselves, but is also weighing on the overall investment-grade corporate bond market.
Given these dynamics, you could argue that the global economy would benefit from the emergence of another avenue for growth. However, with policy and geopolitical headwinds persisting, and so much capital already allocated to the AI ecosystem, the persistence of positive investor sentiment around AI is likely necessary to avoid a decline in stocks and/or a widening of credit spreads.
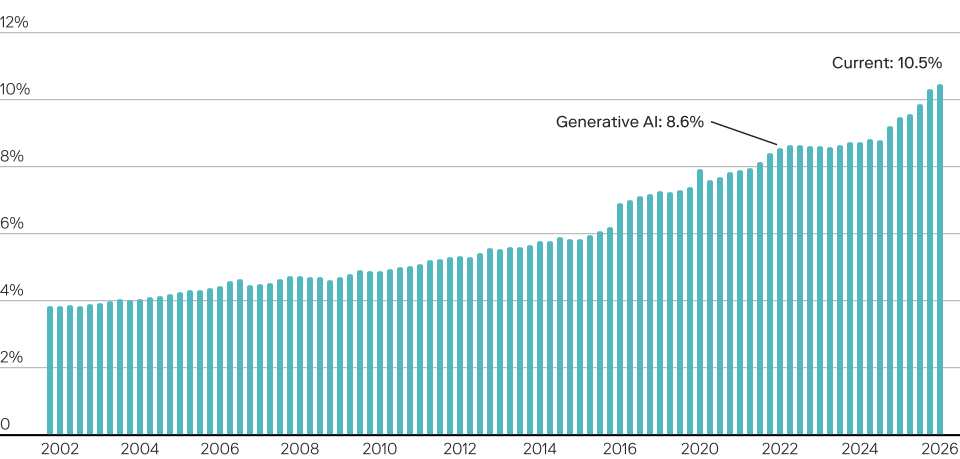
Source: Bloomberg as of June 30, 2026. AI Proxy includes intellectual property products and info processing equipment.
The ripple effects of a shift to more subdued expectations for AI would not only impair growth due to slower investment, but would likely also translate into a meaningful headwind for the consumer. U.S. households are about 1.7 times more exposed to U.S. equities than they were before the financial crisis, and financial assets are nearly 70% of household assets.9 The appreciation of equity markets since 2023 has provided a cushion for continued spending against a backdrop of higher prices, and without the same rate of wage growth for high-income households that we see in low-income jobs. If equities falter, however, both the desire and the capacity to spend could be impaired—resulting in a more meaningful slowdown than many anticipate.
The threat of a shift in sentiment and spending in AI cannot be easily quantified because of broad economic and market exposure to the theme. While we do not believe this is an inflection point, the theme is maturing; determining where to find exposure to the next phase of the AI trend will likely prove more difficult than over the past three years. Alternatively, growth could continue at the current robust pace, which would further complicate the decisions of policymakers. Finding a balance could be a key challenge for investors over the next several quarters, and we anticipate that further volatility—particularly around policy and capital expenditures—could create risks to the stock market rally.
It is difficult to make a case that above-average growth, driven by transformative innovation, is bad for investors in the long run. However, for now, and particularly when combined with still loose monetary and fiscal policy, it threatens to drive inflation that is difficult to contain. Such issues are evident in our now more selective risk stance. We have reduced global equities to an “at target” view given rising long-term yields and an uncertain rate path.
Our conviction on AI capital expenditures supports our U.S. large-cap overweight, while we anticipate that earnings strength could broaden further. We have also softened our enthusiasm for U.S. small and midcap stocks in light of their sensitivity to higher rates, and see narrower opportunities in emerging markets after their strong, concentrated performance.
Real rate repricing is largely driving fixed income returns. We believe that global bond markets are assuming more restrictive monetary policy than is likely to materialize, but we would still modestly trim duration given ongoing volatility. Credit spreads have been stable, and we continue to favor quality (BB rated) high-yield bonds. Our focus in private markets and alternatives is on diversification, leading to an overweight view of commodities, while we favor real estate that offers exposure to data centers and power. Even with slow distributions, we see potential within private equity in secondaries and co-investments, while the availability of attractive spreads and higher all-in yields in private credit could entice investors as the noise subsides.
Overall, we are watching the opportunities and risks that emanate from a higher growth environment, and positioning portfolios appropriately. We remain positive on risk assets but believe that selectivity will likely prove essential in the coming months.
1 Source: Bloomberg. Data as of September 30, 2026. Indexes are as follows: S&P 500 (U.S. large-cap stocks), Russell 2000 (U.S. small caps), MSCI EAFE (non-U.S. developed), MSCI Emerging Market, Bloomberg U.S. Aggregate Bond, Bloomberg U.S. Leveraged Loan, Bloomberg U.S Municipal Bond and Bloomberg Commodity.
2 Source: Bloomberg. Data as of September 30, 2026.
3 Source: Bloomberg and Federal Reserve. Data as of September 30, 2026.
4 Source: Strategas. Data as of September 30, 2026.
5 Source: Bloomberg. Data as of October 2, 2026.
6 Source: Company reports.
7 Source: FactSet. Data as of September 30, 2026.
8 Source: Goldman Sachs Research. Data as of September 17, 2026.
9 Source: Bloomberg, Federal Reserve. Data as of June 30, 2026.
This material is provided for informational and educational purposes only and nothing herein constitutes investment, legal, accounting or tax advice, or a recommendation to buy, sell or hold a security. This material is general in nature and is not directed to any category of investors and should not be regarded as individualized, a recommendation, investment advice or a suggestion to engage in or refrain from any investment-related course of action. Investment decisions and the appropriateness of this material should be made based on an investor’s individual objectives and circumstances and in consultation with his or her advisors. This material is not intended as a formal research report and should not be relied upon as a basis for making an investment decision. The firm, its employees and advisory clients may hold positions within sectors discussed, including any companies specifically identified. Specific securities identified and described do not represent all of the securities purchased, sold or recommended for advisory clients. It should not be assumed that any investments in securities, companies, sectors or markets identified and described were or will be profitable. Neuberger, as well as its employees, does not provide tax or legal advice. You should consult your accountant, tax adviser and/or attorney for advice concerning your particular circumstances. Information is obtained from sources deemed reliable, but there is no representation or warranty as to its accuracy, completeness or reliability. All information is current as of the date of this material and is subject to change without notice. Any views or opinions expressed may not reflect those of the firm as a whole and Neuberger does not endorse any third-party views expressed. Third-party economic or market estimates discussed herein may or may not be realized and no opinion or representation is being given regarding such estimates. Neuberger products and services may not be available in all jurisdictions or to all client types. The use of tools cannot guarantee performance. Diversification does not guarantee profit or protect against loss in declining markets. As with any investment, there is the possibility of profit as well as the risk of loss. Investing entails risks, including possible loss of principal. Investments in hedge funds and private equity are speculative and involve a higher degree of risk than more traditional investments. Investments in hedge funds and private equity are intended for sophisticated investors only. Unless otherwise indicated, returns reflect reinvestment of dividends and distributions. Indexes are unmanaged and are not available for direct investment. This material may include estimates, outlooks, projections and other “forward-looking statements.” Due to a variety of factors, actual events may differ significantly from those presented. Investing entails risks, including possible loss of principal. Past performance is no guarantee of future results.
The views expressed herein may include those of the Neuberger Multi-Asset Class (MAC) team, Neuberger’s Asset Allocation Committee and Neuberger’s Wealth Investment Group. The Asset Allocation Committee is comprised of professionals across multiple disciplines, including equity and fixed income strategists and portfolio managers. The Asset Allocation Committee reviews and sets long-term asset allocation models, establishes preferred near-term tactical asset class allocations and, upon request, reviews asset allocations for large, diversified mandates. Tactical asset allocation views are based on a hypothetical reference portfolio. The Neuberger Wealth Investment Group analyzes market and economic indicators to develop asset allocation strategies. The Neuberger Wealth Investment Group consists of five investment professionals and works in partnership with the Office of the CIO. The Neuberger Wealth Investment Group also consults regularly with portfolio managers and investment officers across the firm. The views of the MAC team, the Asset Allocation Committee and the Neuberger Wealth Investment Group may not reflect the views of the firm as a whole, and Neuberger advisers and portfolio managers may take contrary positions to the views of the MAC team, the Asset Allocation Committee and the Neuberger Wealth Investment Group. The MAC team, the Asset Allocation Committee and Neuberger Wealth Investment Group views do not constitute a prediction or projection of future events or future market behavior. This material may include estimates, outlooks, projections and other “forward-looking statements.” Due to a variety of factors, actual events or market behavior may differ significantly from any views expressed or any historical results. Nothing herein constitutes a prediction or projection of future events or future market or economic behavior. The duration and characteristics of past market/economic cycles and market behavior, including length and recovery time of past recessions and market downturns, is no indication of the duration and characteristics of any current or future market/ economic cycles or behavior.
Hypothetical growth examples are for informational and educational purposes only.
Neuberger Berman Investment Advisers LLC is a registered investment adviser. The “Neuberger” name and logo are service marks of Neuberger Berman Group LLC.