NEWS AND INSIGHTS | MUNICIPAL BASIS POINTS
Gauging Municipal Volatility—and Opportunity
十月 22, 2026

Municipal bond markets now offer historically compelling yields and relative valuations.
DOWNLOAD REPORT
A tough quarter leaves municipal yields at historically generous levels, while reinforcing the value of security selection.
The third quarter of 2026 was challenging across fixed income markets, with municipal bonds delivering relative underperformance, most of which occurred in September. The catalyst was a continued backup in Treasury rates. The Federal Reserve raised its policy rate at its September meeting, building on the hawkish tone that new Chair Kevin Warsh established at the central bank’s July meeting and at the Jackson Hole symposium in late August. The market is now expecting a rate-hiking cycle of roughly three additional 25-basis-point increases.
September was a particularly challenging month for municipals. Due to the federal tax exemption, municipal yields typically trade with less volatility than Treasury counterparts. So, why did they move so much in September?
In our view, one thing that likely did not contribute to the sell-off was credit quality. Investment grade munis remain among the highest-quality and most resilient fixed income credit segments. Given continued U.S. economic strength, we believe the backdrop for municipal credit quality continues to be favorable. Rather, we believe other factors were at play:
All in, the Bloomberg Investment Grade Municipal Index returned -4.05% in September, its worst total return month since 2008; the full 3Q return of -5.78% was the second worst for a quarter since 1989.1
Stepping back, the municipal market has experienced—and largely recovered from—other sharp sell-offs over the years, including during the “Taper Tantrum” of 2013, the rate-hiking cycle of 2022 and, most recently, the “Liberation Day” tariff downdraft of April 2025.
Moreover, municipal absolute yields are now at levels not seen in decades.2 For example, five-year AAA munis are yielding approximately 3.7%, which is 73% of the equivalent Treasury yield, and 10-year AAA munis are yielding 4.1% or 77% of the 10-year Treasury yield—relative valuations that are far better than recent averages.3 For intermediate investment grade munis,4 the yield is 4.49%, which equates to a taxable equivalent yield5 of roughly 7.58%—within shouting distance of long-term equity returns—for an AA rated fixed income asset class. In addition, the municipal market now has a significant yield cushion should rates continue to be volatile.
It is hard to predict when Treasury rates could stabilize given uncertainty around the war in Iran. However, given the dramatic rise in yields, we think investors will eventually come to recognize the significant value within the municipal market and, at some point, start to buy tax-exempt securities in a more meaningful way. In the meantime, we favor capitalizing on the higher yield environment, looking for mispriced securities and harvesting tax losses where appropriate in separate accounts. While we recognize how difficult this environment has been for investors, we believe that staying the course is likely to prove rewarding over time, particularly given new opportunities we see in the municipal market.
Yields, valuation and a positive technical turn.
Rising Treasury yields, a hawkish Fed and higher oil prices are keeping inflation worries front and center. Softer reinvestment flows in September and October, and a surge in new municipal issuance have added to the pressure. In the wake of these events, municipal yields are at their highest levels in about two decades.
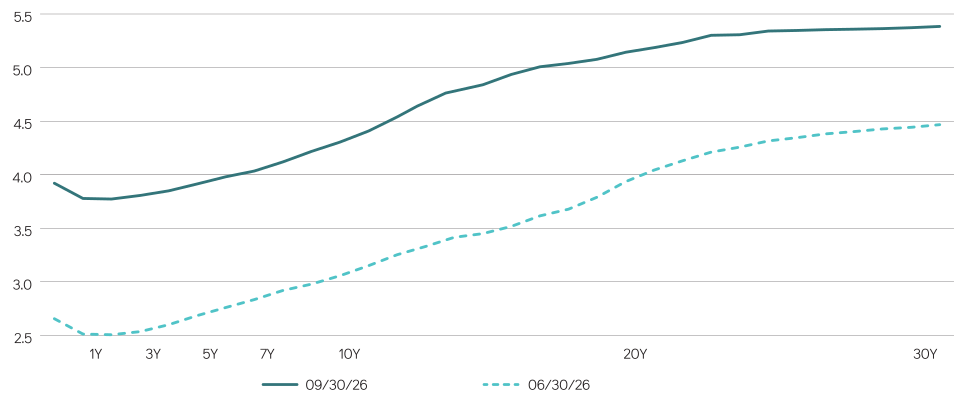
Source: Bloomberg. Data as of September 30, 2026.
We remain cautious on duration (price sensitivity to interest rate changes), but believe higher yields and heavier new-issue supply may provide attractive opportunities. In this volatile market, we favor actively harvesting losses where appropriate in separate accounts.
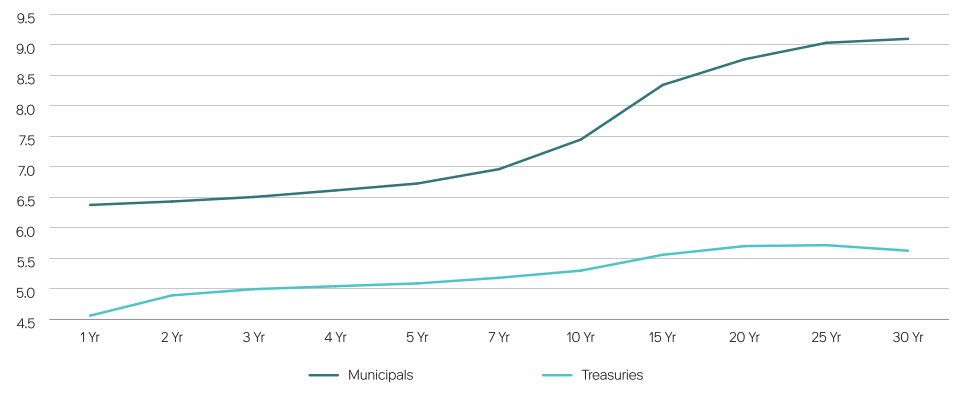
Source: Bloomberg. Data as of September 30, 2026. Assumes a 37% marginal tax combined with an ACA tax of 3.8% for a total rate of 40.8%. Municipals are AA general obligation bonds.
We are likely experiencing higher-than-normal new issuance in October, ahead of the midterms, giving investors a window to put sidelined cash to work. Looking ahead, that supply should fade just as a large wave of reinvestment arrives in December; more money chasing fewer available bonds could support munis going forward.
Pressure is building across public school districts, but we continue to find well-managed issuers with favorable credit trends.
School districts have long been a healthy corner of the municipal market, supported by local property taxes, state funding and a strong record of meeting debt service on time. However, although credit quality has held up well historically, it is now being tested across the sector. As a result, we believe careful issuer selection matters more than ever, and that districts with sound finances and proactive leadership can still offer compelling opportunities.
The primary concern is straightforward. Expenses are growing faster than revenues, as salaries, benefits, special education services and everyday operating costs continue to climb. Temporary federal aid that supported districts during the pandemic has also dropped, and gains in local property taxes and state funding, though meaningful in some places, have not been enough to make up the shortfall.
Falling enrollment is compounding the problem by further weakening revenues. Lower birth rates and immigration are shrinking the pool of school-age children in many communities,6 and because most state funding is distributed on a per-student basis, fewer children translates into less revenue.
Families also have more options than before. Charter schools, which are publicly funded but independently run, are expanding in many states. More states are also offering school choice vouchers, which let families use public dollars for private school tuition, moving both the student and the funding outside the public system. A new federal tax credit could add to this trend by drawing more students away from public schools. The Educational Choice for Children Act, part of the One Big Beautiful Bill Act, funds scholarships that eligible families can use for private or alternative education. Together, these forces are expected to push enrollment lower across the public school system.
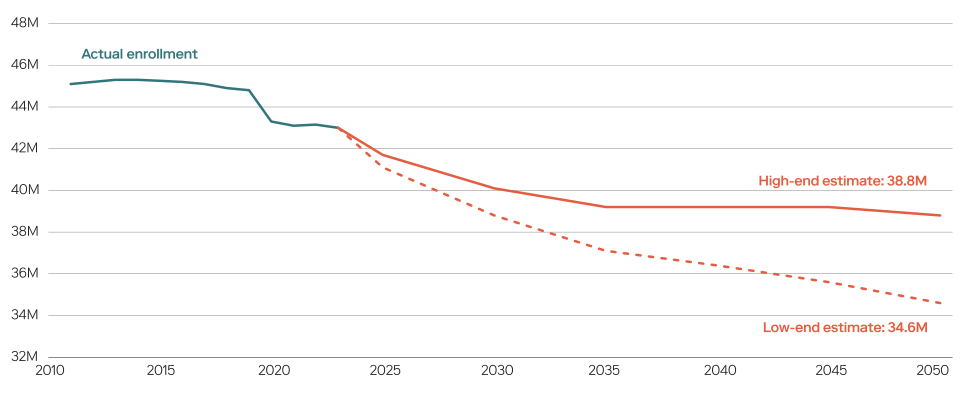
Source: National Center for Education Statistics, Brookings Institution. Data as of August 2026.
Options for replacing lost revenue may be limited. Districts have historically turned to voters for new taxes to close budget gaps, but growing affordability concerns could make approval more difficult. Reserves, which expanded considerably in recent years, have now plateaued, leaving districts with less cushion to absorb shortfalls. Rating agencies have recently downgraded more districts than they have upgraded,7 a sign that pressure is spreading.
Fewer students do not automatically mean lower costs. As enrollment declines, districts often keep paying for staff and buildings they no longer need. Teacher salaries and health benefits continue to rise, and facilities built for larger classes still require heating and repairs. Staffing reductions and school closures are the most direct responses, but even closed buildings can be difficult to sell or reuse, leaving the district responsible for upkeep. Because spending cuts trail revenue losses, districts can face short-term budget gaps even when they respond quickly. Cuts take time to plan and implement, and community opposition can stretch that timeline further as families organize quickly to protect neighborhood schools and their teachers. The result is often that revenue follows students out the door while the biggest expenses can stay behind.
With budget pressure mounting across the sector, we believe effective governance matters more than ever. The strongest districts plan ahead, identifying budget gaps before they emerge and making measured spending adjustments early rather than waiting for a crisis. Weaker districts tend to be more reactive, allowing structural deficits to widen and drawing down reserves further.
Pressure does not affect every district equally and some trends remain favorable despite the sector headwinds. Taxable property values have grown in many communities, lifting tax collections, a core source of school district funding. Reserves have slipped from their recent peak, but the strong growth of prior years has left most districts with adequate cushions, giving them time to address budgetary constraints. Some districts are even bucking the trend, with stable or growing enrollment supporting revenue. Even where enrollment is flat or declining, the strongest districts are those budgeting conservatively and acting early to offset anticipated revenue reductions.
We typically find opportunity where these strengths come together: a stable or growing tax base, healthy reserves and management teams that budget conservatively in the face of enrollment declines. In our view, districts with all three should be well positioned to withstand tighter budgets and maintain stable credit profiles as the sector’s weaker issuers come under greater strain.
In our view, credit selection largely drives results in the public school district sector, and careful work can still be rewarded with attractive yield. Rather than owning school districts broadly, we favor evaluating each district on its own merits, starting with a close read of audited financials, budgets and multiyear forecasts. We examine how reserve levels and payroll costs have trended and whether enrollment projections, and the state funding tied to them, are realistic. We also watch for early warning signs, including structural deficits masked by one-time funds, thinning reserves and enrollment losses without a matching plan to cut costs. Once invested, we believe it is important to monitor each holding for shifts in enrollment, reserves and management behavior. Investors should be prepared to sell early should trends weaken. In a sector where pressure is spreading, we believe selectivity is the best insulation for investor capital.
1 Source: Bloomberg for all data unless otherwise stated, as of September 30, 2026.
2 Data as of September 30, 2026, Bloomberg AAA municipal yield.
3 Last five years through September 30, 2026.
4 As measured by the Bloomberg 1-15 Year Municipal Bond Index.
5 Assumes a 37% marginal tax combined with an ACA tax of 3.8% for a total rate of 40.8%.
6 Source: Multiple news outlets such as Reason Foundation, “Latest data shows just 10 states have avoided K-12 public school enrollment decreases,” June 16, 2026, and Reuters, “Immigrant student enrollment is dwindling at schools across the US amid immigration crackdowns,” November 17, 2025.
7 Source: Moody’s “Medians” report, September 1, 2026. 1Q 2026 rating actions highlight the trend.
This material is provided for informational purposes only and nothing herein constitutes investment legal accounting or tax advice or a recommendation to buy sell or hold a security. This material is general in nature and is not directed to any category of investors and should not be regarded as individualized recommendation investment advice or a suggestion to engage in or refrain from any investment-related course of action. Neuberger is not providing this material in a fiduciary capacity, and has a financial interest in the sale of its products and services. Neuberger as well as its employees does not provide tax or legal advice. You should consult your accountant tax adviser and/or attorney for advice concerning your particular circumstances. Information is obtained from sources deemed reliable, but there is no representation or warranty as to its accuracy completeness or reliability. All information is current as of the date of this material and is subject to change without notice. Any views or opinions expressed may not reflect those of the firm as a whole. Neuberger products and services may not be available in all jurisdictions or to all client types. Investing entails risks including possible loss of principal. Investments in hedge funds and private equity are speculative and involve a higher degree of risk than more traditional investments. Investments in hedge funds and private equity are intended for sophisticated investors only. Indexes are unmanaged and are not available for direct investment. Past performance is no guarantee of future results.
Unless otherwise indicated, portfolio characteristics, including attribution, yield data, relative returns and risk statistics are shown gross of fees. The views expressed herein do not constitute a prediction or projection of future events or future market behavior. This material may include estimates, outlooks, projections and other “forward-looking statements.” Due to a variety of factors, actual events or market behavior may differ significantly from any views expressed.
Neuberger Berman Investment Advisers LLC is a registered investment adviser. The “Neuberger” name and logo are service marks of Neuberger Berman Group LLC.