NEWS AND INSIGHTS | MARKET COMMENTARY
Higher Rates Can’t Stop the Rally
September 04, 2026

Portfolio positioning remains risk-on, with overweights in small caps, Japan and emerging markets, constructive views on credit and an overweight in commodities.
Searching for a trend, investors came into August bemused; while global equity earnings continued to deliver on the lofty promises made by strategists and analysts alike, July’s returns were disappointing, with meaningful pullbacks notched for a number of 2026 winners. In addition, the Fed’s lack of forward guidance and the potential for tighter financial conditions created concerns that a less supportive environment for meaningful capital expenditure, increasingly funded by debt, could slow the AI roll: the driving force behind the U.S. economy, estimated at over 10% of U.S. GDP.
As the minutes from the July meeting showed, investors had reason to be concerned about the Fed. While there were only three dissenters to the decision to hold rates steady, the release revealed that “many participants” agreed that a hike would be necessary without meaningfully progress on inflation, and that progress could be hindered by the continued conflict in the Middle East and the associated supply shocks. July’s data, however, was more encouraging. July core CPI came in as expected at +0.2% MoM and +2.5% YoY (the softest since the post-COVID surge), with shelter disinflation, falling energy prices, and lower motor vehicle insurance and medical costs offsetting increases in used cars, airfares and utility gas.
July PPI was flat overall as well, with a bit of a bump in core prices, up +0.4% MoM; however, with the latter attributable to an increase in portfolio management fees, there was a sign of relief for markets looking ahead to August’s prints. In addition, July nonfarm payrolls fell -23,000 versus expectations for +80,000, with sizable downward revisions to May and June, driven by weakness in leisure/hospitality, retail, government and financial activities, although construction, manufacturing and healthcare offered some offset alongside a declining labor participation rate.
The equity markets reacted positively to the U.S. economic data, posting solid returns despite growing pressure on global yields. The S&P 500 returned 2.7%, its best August since 2021, led by a rebound in the barbell of technology stocks paired with energy, healthcare and materials. Industrials stocks pulled back with the building backlash against data centers, while interest rate-sensitive areas like real estate and U.S. small caps modestly underperformed. Along with the strength in the Nasdaq, a rebound in emerging markets pointed to strong sentiment around AI coming off July’s choppiness.
Not surprisingly, fixed income returns were muted as investors digested the Fed’s commentary and weighed the threat of an unanchored 10-year Treasury yield, but the cooler economic data kept short yields in check. Lower-quality credit outperformed higher quality on the month. Commodities were higher, led by a sharp upward move in precious metals.
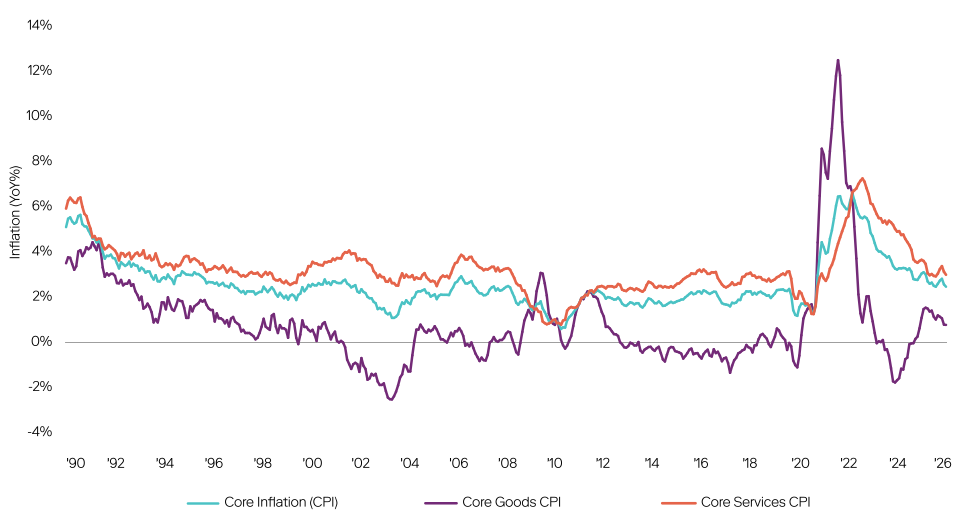
Source: Bloomberg as of July 2026.
Following the Fed’s July meeting, in which Chair Kevin Warsh appeared challenged to articulate the rationale behind the rate hold given the Fed’s focus on inflation, his speech at the Jackson Hole Economic Policy Symposium became even more critical. Further complicating matters was a steady rise in the 30-year Treasury yield throughout August, which seemed to indicate that U.S. bond investors had made up their mind that the Fed would move from its neutral posture sooner rather than later.
The situation is more complicated than it seems. The move higher at the long end of the U.S. yield curve could be attributable to higher inflation expectations, a more robust growth outlook, competition from highly rated AI-related debt issuance, fears of fiscal largesse or a broader move higher in government yields. It is likely a combination of all the above, which makes combatting the move even more challenging. The timing is less than ideal. U.S. voters are just three months out from midterm elections in which the control of the House and to a lesser extent the Senate hang in the balance. The key voter issue is the U.S. economy, and specifically the affordability challenges facing U.S. households. Lower interest rates were among Treasury Secretary Scott Bessent’s stated aims coming into the Trump administration’s second term, and while the Fed delivered three rate cuts, Bessent faces an uphill battle as a burgeoning budget deficit emboldens bond vigilantes. Global yields have been on the rise given the similar fiscal challenges, and the threat of higher interest rates upending economic momentum feels real in this environment.
Acknowledging the near-term challenges of higher consumer borrowing rates, in August Bessent announced his plan to double the size of the Treasury’s buybacks in the long end of the curve, from $2 billion to at least $4 billion per operation; the announcement came off-cycle, just two weeks after the quarterly refunding schedule came out, and immediately following a 30-year Treasury auction that went off at the highest yield since 2011. While the “twist” playbook is nothing new, Bessent’s indication that his efforts to keep yields from becoming anchored would also include a dynamic use of the Treasury General Account, which he's been rebuilding toward that roughly $1 trillion target consistent with the Treasury's long standing cash policy, points to a more protracted policy change, which would insulate the long end of the curve from shorter term funding needs.
With the Treasury attempting to pull yields down, Warsh’s address at Jackson Hole could have gone in a number of different directions; he chose to further reinforce the Fed’s concerns about inflation. Indeed, while his far-reaching address covered AI, his views on Fed functioning and the overall state of the economy, his comments on inflation caused the market concern. Instead of relying on the recently cooler data as an opportunity to lean against the recent moves in yields, he leaned into his view—likely shared by an increasing number of FOMC voters—that price pressures are broader, and that disinflation up to this point has been insufficient. While still anchoring to his aversion to forward guidance, we believe the speech was clear enough that skipping a hike now probably needs a real CPI miss.
As a result, we enter September with the Treasury and Fed seemingly at odds on policy. One could argue that they are targeting different parts of the yield curve, but it goes deeper than that: They are focused on attempting to solve the same problem, but in different ways. Inflation has been above the Fed’s target for five years, and the higher costs weigh heavily on consumers and small businesses. Restrictive policy could help to slow growth, which in turn could anchor prices. The Treasury also wants to ease the burden on consumers and businesses, as well as the government itself, given the size of the debt and the positive impact lower rates could have on servicing it. The common denominator here is that slower economic growth could deliver a parallel shift lower in the curve, but the benefits of that may not outweigh the costs. And with AI still acting as a remarkably strong catalyst for global growth, policy may prove ineffective in the short term in slowing that momentum.
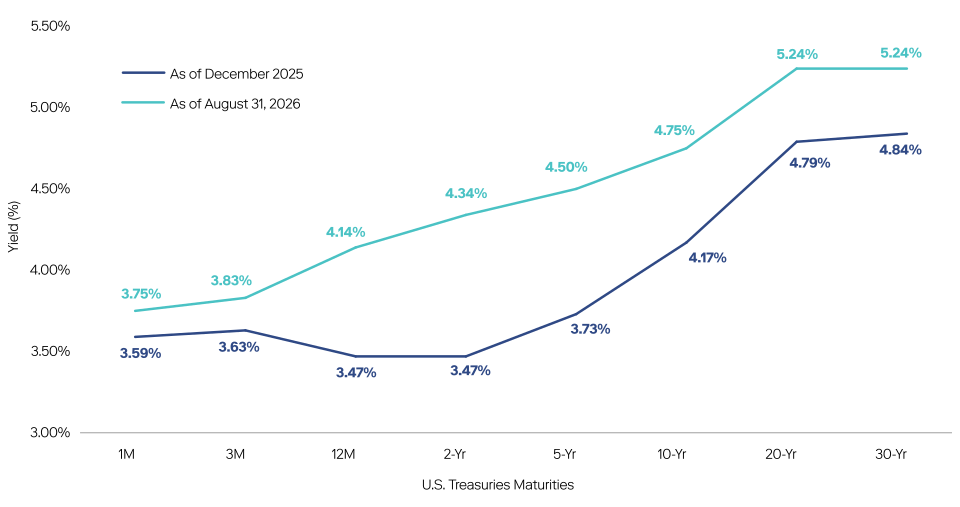
Bloomberg, as of August 31st, 2026
Equities. We remain overweight global equities, driven by the AI capital expenditure cycle, historically strong earnings and margins, and evidence that the manufacturing rebound globally has taken hold. We remain constructive on broadening, and despite recent concerns about higher yields, are overweight U.S. small caps and Japan. We are also constructive on China and emerging markets, given the accelerating global growth and the adjacency of those economies to the AI ecosystem.
Fixed Income. Rising real rates, not inflation, are the dominant force in fixed income. We are at-target to U.S. Treasuries, with a preference for the short end of the yield curve, particularly given the continued pressure on the long end of the curve. Credit fundamentals are intact, and we are constructive on U.S. investment grade and high yield corporates despite tight spreads. Outside of the U.S., we maintained our overweight of European fixed income due to slowing growth, while emerging market debt has become more attractive.
Private Markets. Private equity and credit remain at target weight, with secondaries and co-investments offering compelling entry points given the continued need for liquidity. Distributions are picking up, but the backlog remains significant. Commodities are at a modest overweight as a diversifier and inflation buffer, with energy prices still elevated and the demand for precious metals strengthening into the back half of 2026. We upgraded hedged strategies to overweight, favoring absolute-return and macro approaches as traditional equity-bond diversification proves less effective.
| Aug-26 | 3M | YTD | |
|---|---|---|---|
| Equities | |||
| Major U.S. Indices | |||
| S&P 500 Index | 2.72% | 1.68% | 13.14% |
| Nasdaq Composite | 3.99% | -2.09% | 13.90% |
| Dow Jones | 1.47% | 4.62% | 11.79% |
| U.S. Size Indices | |||
| Large Cap | 2.82% | 1.94% | 13.03% |
| Mid Cap | 1.86% | 4.37% | 16.72% |
| Small Cap | 0.98% | 1.58% | 20.01% |
| All Cap | 2.74% | 1.95% | 13.37% |
| U.S. Style Indices | |||
| All Cap Growth | 3.63% | -3.98% | 4.46% |
| All Cap Value | 1.96% | 8.16% | 23.17% |
| Global Equity Indices | |||
| ACWI | 2.67% | 1.92% | 14.31% |
| ACWI ex US | 2.57% | 2.32% | 17.01% |
| DM Non-U.S. Equities | 2.00% | 4.10% | 14.24% |
| EM Equities | 3.40% | -1.10% | 24.35% |
| Portfolios | |||
| 50/50 Portfolio | 1.25% | 0.27% | 6.67% |
| Aug-26 | 3M | YTD | |
|---|---|---|---|
| Fixed Income Currencies & Commodities | |||
| Major U.S. Indices | |||
| Cash | 0.28% | 0.90% | 2.37% |
| U.S. Aggregate | 0.39% | -0.68% | -0.31% |
| Munis | -0.23% | -1.13% | 0.20% |
| U.S. Corporates | |||
| Investment Grade | 0.43% | -1.06% | -0.40% |
| High Yield | 1.00% | 1.08% | 2.85% |
| Short Duration (1.9 Yrs) | 0.26% | 0.49% | 1.23% |
| Long Duration (12.8 Yrs) | 0.83% | -2.46% | -2.41% |
| Global Fixed Income Indices | |||
| Global Aggregate | 0.45% | -0.79% | -0.30% |
| EMD Corporates | 0.62% | 0.46% | 2.22% |
| Commodities | |||
| Commodities | 7.39% | 5.63% | 32.06% |
| U.S. Treasury Yields | |||
| U.S. 10-Year Yield | 0.02% | 0.31% | 0.58% |
| U.S. 2-Year Yield | 0.05% | 0.34% | 0.87% |
| FX | |||
| U.S. Dollar | -0.49% | 0.49% | 1.12% |
Source: Bloomberg, Total returns as of August 31st, 2026. S&P 500 Index is represented by S&P 500 Total Return Index. Nasdaq Composite NASDAQ-Composite Total Return Index. Dow Jones is represented by Dow Jones Industrial Average TR. Large Cap is represented by Russell 1000 Total Return Index. Mid Cap is represented by Russell Midcap Index Total Return. Small Cap is represented by Russell 2000 Total Return Index. All Cap is represented by Russell 3000 Total Return Index. Large Cap Growth is represented by Russell 1000 Growth Total Return. Large Cap Value is represented by Russell 1000 Value Index Total Return. Small Cap Growth is represented by Russell 2000 Growth Total Return. Small Cap Value is represented by Russell 2000 Value Total Return. ACWI is represented by MSCI ACWI Net Total Return USD Index. ACWI ex US is represented by MSCI ACWI ex USA Net Total Return USD Index. DM Non-U.S. Equities is represented by MSCI Daily TR Gross EAFE USD. EM Equities is represented by MSCI Daily TR Gross EM USD. Cash is represented by ICE BofA US 3-Month Treasury Bill Index. U.S. Aggregate is represented by Bloomberg US Agg Total Return Value Unhedged USD. Munis is represented by Bloomberg Municipal Bond Index Total Return Index Value Unhedged USD. Munis Short Duration is represented by Bloomberg Municipal Bond: Muni Short (1-5) Total Return Unhedged USD. Munis Intermediate Duration is represented by Bloomberg Municipal Bond: Muni Intermediate (5-10) TR Unhedged USD. Investment Grade is represented by Bloomberg US Corporate Total Return Value Unhedged USD. High Yield is represented by Bloomberg US High Yield BB/B 2% Issuer Cap Total Return Index Value Unhedged USD. Short Duration is represented by Bloomberg US Agg 1-3 Year Total Return Value Unhedged USD. Long Duration is represented by Bloomberg US Agg 10+ Year Total Return Value Unhedged USD. Global Aggregate is represented by Bloomberg Global-Aggregate Total Return Index Value Unhedged USD. EMD Corporates is represented by J.P. Morgan Corporate EMBI Diversified Composite Index Level. EMD Sovereigns – USD is represented by J.P. Morgan EMBI Global Diversified Composite. Commodities is represented by Bloomberg Commodity Index Total Return. Commodities ex Energy is represented by Bloomberg Ex-Energy Subindex Total Return. U.S. 10-Year Yield is represented by US Generic Govt 10 Yr.
IMPORTANT INFORMATION:
This material is provided for informational and educational purposes only and nothing herein constitutes investment, legal, accounting or tax advice, or a recommendation to buy, sell or hold a security. This material is general in nature and is not directed to any category of investors and should not be regarded as individualized, a recommendation, investment advice or a suggestion to engage in or refrain from any investment-related course of action. Neither Neuberger nor its employees provide tax or legal advice. All information is current as of the date of this material and is subject to change without notice. The firm, its employees and advisory accounts may hold positions of any companies discussed. Any views or opinions expressed may not reflect those of the firm as a whole. Neuberger products and services may not be available in all jurisdictions or to all client types. Diversification does not guarantee profit or protect against loss in declining markets. Investments in private equity are speculative and involve a higher degree of risk than more traditional investments. Investments in private equity are intended for sophisticated investors only. Unless otherwise indicated, returns shown reflect reinvestment of dividends and distributions. Indexes are unmanaged and are not available for direct investment. Investing entails risks, including possible loss of principal. Past performance is no guarantee of future results.
Portfolio positioning views expressed herein are those of Neuberger Wealth Investment Group which may include those of the Neuberger’s Asset Allocation Committee. Asset allocation and positioning views are based on a hypothetical reference portfolio. The Neuberger Wealth Investment Group analyzes market and economic indicators to develop asset allocation strategies. The Neuberger Wealth Investment Group works in partnership with the Office of the CIO. The Neuberger Wealth Investment Group also consults regularly with portfolio managers and investment officers across the firm. The Asset Allocation Committee is comprised of professionals across multiple disciplines, including equity and fixed income strategists and portfolio managers. The Asset Allocation Committee reviews and sets long-term asset allocation models, establishes preferred near-term tactical asset class allocations and, upon request, reviews asset allocations for large diversified mandates. Asset Allocation Committee members are polled on asset classes and the positional views are representative of an Asset Allocation Committee consensus. The views of the Asset Allocation Committee and the Neuberger Wealth Investment Group may not reflect the views of the firm as a whole and Neuberger advisers and portfolio managers may take contrary positions to the views of the Asset Allocation Committee or the Neuberger Wealth Investment Group. The Asset Allocation Committee and the Neuberger Wealth Investment Group views do not constitute a prediction or projection of future events or future market behavior. Defensive positioning generally means an underweight bias on allocations to risk assets such as equities and alternatives. Positioning views may change over time without notice and actual client positioning may vary significantly. Discussion of yield characteristics or total returns of different asset classes are for illustrative purposes only. Such asset classes, such as equities and fixed income, may have significantly different overall risk-return characteristics which should be considered before investing.
The information in this material may contain projections, market outlooks or other forward-looking statements regarding future events, including economic, asset class and market outlooks or expectations, and is only current as of the date indicated. There is no assurance that such events, outlook and expectations will be achieved, and actual results may be significantly different than that shown here. The duration and characteristics of past market/economic cycles and market behavior, including any bull/bear markets, is no indication of the duration and characteristics of any current or future be market/economic cycles or behavior. Information on historical observations about asset or sub-asset classes is not intended to represent or predict future events. Historical trends do not imply, forecast or guarantee future results. Information is based on current views and market conditions, which will fluctuate and may be superseded by subsequent market events or for other reasons.
Discussions of any specific sectors and companies are for informational purposes only. This material is not intended as a formal research report and should not be relied upon as a basis for making an investment decision. The firm, its employees and advisory accounts may hold positions of any companies discussed. Nothing herein constitutes a recommendation to buy, sell or hold a security. It should not be assumed that any investments in securities, companies, sectors or markets identified and described were or will be profitable. Investment decisions and the appropriateness of this content should be made based on an investor's individual objectives and circumstances and in consultation with his or her advisors.
Neuberger Investment Advisers LLC is a registered investment adviser.
The “Neuberger” name and logo are service marks of Neuberger Berman Group LLC.
© 2026 Neuberger Berman Group LLC. All rights reserved.