NEWS AND INSIGHTS | MARKET COMMENTARY
Index Declines Mask Diversification Benefits
November 05, 2026

We are overweight U.S. large cap, moving small and midcap to target, and favoring Japan and China over Europe. In fixed income, we lean toward shorter duration and higher quality, and, in alternatives, we are overweight commodities, hedged strategies and private real estate.
Equities were challenged in October as AI enablers faced questions of supply and demand, coupled with the threat of higher borrowing costs. With central banks globally poised to deliver further rate hikes, and cash flows being further cannibalized to fund investment, the tenor of the AI buildout continues to evolve into one more focused on monetization and justification of the massive investments already made, as well as the additional capex projected into 2027 and 2028.
All eyes were on economic data ahead of the Federal Reserve’s October meeting. September payrolls rose just 29k against a 90k consensus, and downward revisions of 31k to July and 29k to August painted a more dovish picture. The theme continues to center on slower hiring rather than layoffs. Health care, construction and manufacturing all added jobs, while financial services, information and local government lost them. Labor participation ticked up to 61.8% while unemployment rose to 4.2%; with wages up just 0.1% on the month, and hours flat at 34.4, there's little sign of wage pressure feeding into inflation.
Even without a meaningful contribution from wages, CPI ran hot again in September. Core inflation rose +0.3% MoM (versus +0.2% expected) and +2.6% YoY, and headline increased 0.6% MoM and 3.7% YoY, driven mostly by energy, which was up +5.2% MoM and +20.4% YoY. Food was flat, but most other categories moved higher, including shelter (+0.4%), airfares (+1.2%), used cars (+0.7%) and supercore services (+0.4%). That suggests that energy costs are passing through to consumers, with TVs (-1.9%) and household furnishings (-0.2%) providing the limited bright spots.
In response to this data, the Fed held the fed funds rate at 3.75 – 4.00%, as expected, with Hammack and Cook dissenting in favor of a 25-basis-point hike. The FOMC’s statement upgraded economic growth from "solid" to "strong." Chair Warsh stressed a "timely return" to 2% inflation, pointed to tighter financial conditions since September's hike and laid out a new framework and a revised 2027 and 2028 meeting cadence, with some meetings focused on strategy rather than policy action. We saw the tone as more dovish than in September, and, in our view, a December hike is still very likely. Guidance was hard to read, however, and the Fed's reaction function still looks like a work in progress, which could mean more short-term volatility.
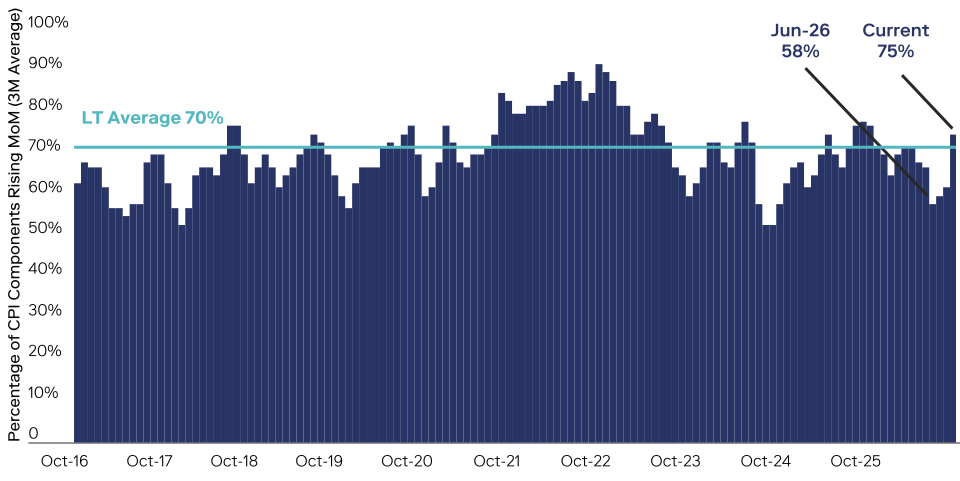
Source: Bloomberg as of September 30, 2026. Using 20 CPI subcategories across core goods, core services, food, and energy.
With the Fed on hold, the next challenge for investors was the U.S. midterm elections. The results, while directionally consistent with expectations, were surprising in their strength, as Democrats took control of both congressional chambers. As of this writing, they have flipped 27 House seats so far, with more likely to come, and added seven Senate seats. They now also hold the governor's seat in all seven of the 2024 swing states, helped by younger voters, women, Latinos and independents. In the near term, President Donald Trump may use the lame duck session to push on the debt ceiling, defense spending and a Supreme Court nomination, but those look like heavy lifts in a holiday-shortened window. Permitting reform, however, may have a better shot. Next year, we believe the new Congress will likely focus on health care spending, credit card rate caps, tariffs on food, food stamps, housing affordability and Iran war funding. The biggest change could be a push to curb data center growth, in part by reviewing 100% expensing, which could weigh on AI enablers.
Yields moved lower in October as the threat of slower AI spending eased concerns about accelerating growth and debt issuance. While credit spreads for select lower-quality issues widened, the bond market broadly rallied on lower yields, with municipals in particular recovering significantly from their September sell-off. Equity indices were mostly lower for the month, but that masked a meaningful rotation away from concentrated technology and communication exposures into other sectors. Significantly, all other sectors within the S&P 500 posted gains in October, led by consumer staples, energy and utilities. Small-cap growth stocks declined modestly, while the rest of the small-cap universe performed well. Europe outperformed Japan, while emerging markets pulled back as AI concerns rippled across the globe. Commodities were higher on another surge in energy prices, while metals lagged.
While we have seen a number of tests for AI investors over the last two years, the pain delivered in October was a wake-up call for any who were at risk of complacency. Following a strong September, when technology outperformed, the rise in interest rates combined with mixed results translated into meaningful downward pressure on quality equity names and lower-quality credits.
What drove the declines? Blaming the increase in yields would be too simple, but it was a factor. The U.S. economy digested a sharp tightening cycle designed to slow demand and counteract the inflationary impulse coming out of the COVID-19 pandemic, showing lower interest-rate sensitivity than previously expected. Consumers and businesses alike benefited from the Fed rate cuts in the fourth quarter of last year, which offset some of the combined tariff and energy price increases. However, with the sharp rise in public and private debt issuance to fund the AI buildout, the sensitivity of the U.S. economy to interest rates has risen meaningfully in a short period of time, and the reaction to the shift higher in global yields has been swift and significant. The higher cost of capital implies a need for greater discipline around capital allocation, but we believe merely slowing spending could be interpreted as a sign that hyperscalers are anticipating a step down in demand expectations. Finding the right balance between the two narratives has proven to be a challenge this quarter.
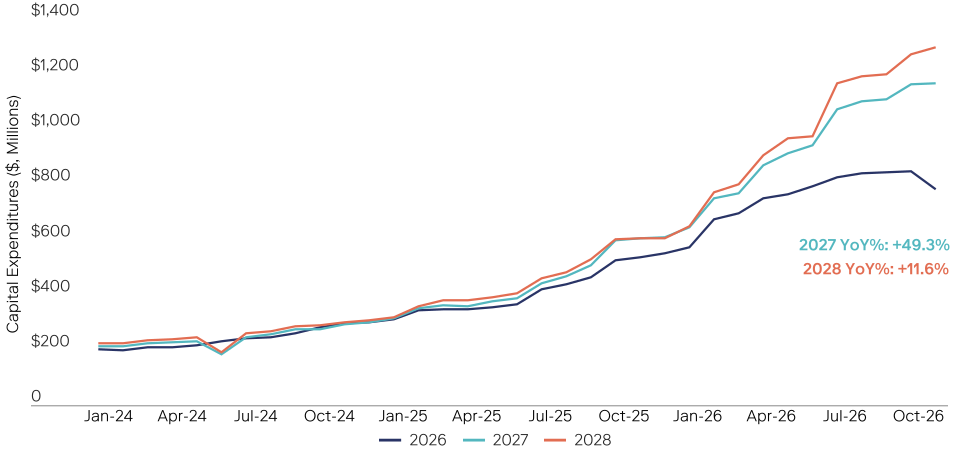
Source: Bloomberg as of October 30,2026. Hyperscalers include Amazon, Microsoft, Alphabet, Meta, and Oracle.
It isn’t just about the narrative, however. Clear efficiency and/or margin gains as reported by companies implementing AI have been slower to materialize in quarterly results than one would have hoped, and companies citing the use of AI will likely prove ineffective in supporting the AI trade as we move further into 2027. Even as the questions swirl around demand, the challenges of delivering on that demand persist. Commodity and component prices have risen sharply this year, increasing the cost of every project in process or projected. The need for power continues, but the data center backlash now has political might behind it now that Democratic governors, who proposed slower data center builds, are set to take office in Texas, Georgia and Ohio.
We would caution against the interpretation that AI enablers can no longer deliver results; instead, we would expect a period of reframing that could bring lofty expectations to more reasonable and, frankly, achievable levels. Underlying U.S. economic strength has been buoyed both by fixed investment and a solid consumer; a more disciplined approach to the AI buildout might slow that growth but not enough to force a recession, in our view. In fact, the recent relief in rates has been attributable to a more modest pace of investment, and therefore could alleviate some of the pressure, particularly on AI related debt, in the near to midterm. AI remains a transformative force, and demand for agentic implementation is material. Selectivity in the AI space remains key, however, and we are emphasizing the importance of diversifying into beneficiaries of AI to capture the next period of performance.
Equities: We remain overweight to U.S. large-cap equities but move small and midcap to “at target.” Outside the U.S., we favor Japan and China, and are cautious on Korea. While we acknowledge the recent strength in European equity earnings, we see current valuations as demanding, particularly given the underwhelming expectations for economic growth.
Fixed Income: Coming into the quarter, we recommended modestly shorter duration posture, with the caveat that moves in the yield curve might create opportunities. In addition, while spreads on lower-quality credit have widened, we maintain an emphasis on higher-quality issues. Within multi-sector portfolios, we are trimming U.S. government securities, agency MBS, and non-U.S. developed markets. As it relates to high yield, we maintain a higher-quality tilt.
Private Markets & Alternatives: We increase our overweight to commodities and maintain our overweight to hedged strategies as a hedge against uncertain equity beta. Private equity and private debt stay at target. Private real estate remains overweight thanks to its stronger diversification profile.
| Oct-26 | 3M | YTD | |
|---|---|---|---|
| Equities | |||
| Major U.S. Indices | |||
| S&P 500 Index | -0.87% | 1.48% | 11.77% |
| Nasdaq Composite | -5.28% | 0.39% | 9.95% |
| Dow Jones | 1.76% | -1.00% | 9.08% |
| U.S. Size Indices | |||
| Large Cap | -0.69% | 1.45% | 11.53% |
| Mid Cap | 3.19% | 0.72% | 15.41% |
| Small Cap | 0.58% | -3.77% | 14.37% |
| All Cap | -0.64% | 1.23% | 11.71% |
| U.S. Style Indices | |||
| All Cap Growth | -5.89% | -0.69% | 0.10% |
| All Cap Value | 4.31% | 2.95% | 24.36% |
| Global Equity Indices | |||
| ACWI | -1.64% | -0.14% | 11.18% |
| ACWI ex US | -2.81% | -2.69% | 11.01% |
| DM Non-U.S. Equities | -0.72% | -1.78% | 10.00% |
| EM Equities | -8.04% | -5.39% | 13.78% |
| Portfolios | |||
| 50/50 Portfolio | 1.49% | 0.29% | 5.64% |
| Oct-26 | 3M | YTD | |
|---|---|---|---|
| Fixed Income Currencies & Commodities | |||
| Major U.S. Indices | |||
| Cash | 0.35% | 0.91% | 3.01% |
| U.S. Aggregate | 2.44% | 0.15% | -0.54% |
| Munis | 3.85% | -0.90% | -0.48% |
| U.S. Corporates | |||
| Investment Grade | 2.16% | -0.19% | -1.02% |
| High Yield | 0.58% | -0.87% | 0.94% |
| Short Duration (1.9 Yrs) | 0.92% | 0.60% | 1.57% |
| Long Duration (12.8 Yrs) | 4.38% | 0.25% | -2.97% |
| Global Fixed Income Indices | |||
| Global Aggregate | 1.41% | -0.56% | -1.30% |
| EMD Corporates | 0.41% | -1.06% | 0.52% |
| Commodities | |||
| Commodities | -0.08% | 7.95% | 32.75% |
| U.S. Treasury Yields | |||
| U.S. 10-Year Yield | -0.36% | 0.19% | 0.76% |
| U.S. 2-Year Yield | -0.30% | 0.30% | 1.11% |
| FX | |||
| U.S. Dollar | 0.42% | 1.97% | 3.62% |
Source: Bloomberg, Total returns as of October 30th,2026. S&P 500 Index is represented by S&P 500 Total Return Index. Nasdaq Composite NASDAQ-Composite Total Return Index. Dow Jones is represented by Dow Jones Industrial Average TR. Large Cap is represented by Russell 1000 Total Return Index. Mid Cap is represented by Russell Midcap Index Total Return. Small Cap is represented by Russell 2000 Total Return Index. All Cap is represented by Russell 3000 Total Return Index. Large Cap Growth is represented by Russell 1000 Growth Total Return. Large Cap Value is represented by Russell 1000 Value Index Total Return. Small Cap Growth is represented by Russell 2000 Growth Total Return. Small Cap Value is represented by Russell 2000 Value Total Return. ACWI is represented by MSCI ACWI Net Total Return USD Index. ACWI ex US is represented by MSCI ACWI ex USA Net Total Return USD Index. DM Non-U.S. Equities is represented by MSCI Daily TR Gross EAFE USD. EM Equities is represented by MSCI Daily TR Gross EM USD. Cash is represented by ICE BofA US 3-Month Treasury Bill Index. U.S. Aggregate is represented by Bloomberg US Agg Total Return Value Unhedged USD. Munis is represented by Bloomberg Municipal Bond Index Total Return Index Value Unhedged USD. Munis Short Duration is represented by Bloomberg Municipal Bond: Muni Short (1-5) Total Return Unhedged USD. Munis Intermediate Duration is represented by Bloomberg Municipal Bond: Muni Intermediate (5-10) TR Unhedged USD. Investment Grade is represented by Bloomberg US Corporate Total Return Value Unhedged USD. High Yield is represented by Bloomberg US High Yield BB/B 2% Issuer Cap Total Return Index Value Unhedged USD. Short Duration is represented by Bloomberg US Agg 1-3 Year Total Return Value Unhedged USD. Long Duration is represented by Bloomberg US Agg 10+ Year Total Return Value Unhedged USD. Global Aggregate is represented by Bloomberg Global-Aggregate Total Return Index Value Unhedged USD. EMD Corporates is represented by J.P. Morgan Corporate EMBI Diversified Composite Index Level. EMD Sovereigns – USD is represented by J.P. Morgan EMBI Global Diversified Composite. Commodities is represented by Bloomberg Commodity Index Total Return. Commodities ex Energy is represented by Bloomberg Ex-Energy Subindex Total Return. U.S. 10-Year Yield is represented by US Generic Govt 10 Yr.
IMPORTANT INFORMATION:
This material is provided for informational and educational purposes only and nothing herein constitutes investment, legal, accounting or tax advice, or a recommendation to buy, sell or hold a security. This material is general in nature and is not directed to any category of investors and should not be regarded as individualized, a recommendation, investment advice or a suggestion to engage in or refrain from any investment-related course of action. Neither Neuberger nor its employees provide tax or legal advice. All information is current as of the date of this material and is subject to change without notice. The firm, its employees and advisory accounts may hold positions of any companies discussed. Any views or opinions expressed may not reflect those of the firm as a whole. Neuberger products and services may not be available in all jurisdictions or to all client types. Diversification does not guarantee profit or protect against loss in declining markets. Investments in private equity are speculative and involve a higher degree of risk than more traditional investments. Investments in private equity are intended for sophisticated investors only. Unless otherwise indicated, returns shown reflect reinvestment of dividends and distributions. Indexes are unmanaged and are not available for direct investment. Investing entails risks, including possible loss of principal. Past performance is no guarantee of future results.
Portfolio positioning views expressed herein are those of Neuberger Wealth Investment Group which may include those of the Neuberger’s Asset Allocation Committee. Asset allocation and positioning views are based on a hypothetical reference portfolio. The Neuberger Wealth Investment Group analyzes market and economic indicators to develop asset allocation strategies. The Neuberger Wealth Investment Group works in partnership with the Office of the CIO. The Neuberger Wealth Investment Group also consults regularly with portfolio managers and investment officers across the firm. The Asset Allocation Committee is comprised of professionals across multiple disciplines, including equity and fixed income strategists and portfolio managers. The Asset Allocation Committee reviews and sets long-term asset allocation models, establishes preferred near-term tactical asset class allocations and, upon request, reviews asset allocations for large diversified mandates. Asset Allocation Committee members are polled on asset classes and the positional views are representative of an Asset Allocation Committee consensus. The views of the Asset Allocation Committee and the Neuberger Wealth Investment Group may not reflect the views of the firm as a whole and Neuberger advisers and portfolio managers may take contrary positions to the views of the Asset Allocation Committee or the Neuberger Wealth Investment Group. The Asset Allocation Committee and the Neuberger Wealth Investment Group views do not constitute a prediction or projection of future events or future market behavior. Defensive positioning generally means an underweight bias on allocations to risk assets such as equities and alternatives. Positioning views may change over time without notice and actual client positioning may vary significantly. Discussion of yield characteristics or total returns of different asset classes are for illustrative purposes only. Such asset classes, such as equities and fixed income, may have significantly different overall risk-return characteristics which should be consider before investing.
The information in this material may contain projections, market outlooks or other forward-looking statements regarding future events, including economic, asset class and market outlooks or expectations, and is only current as of the date indicated. There is no assurance that such events, outlook and expectations will be achieved, and actual results may be significantly different than that shown here. The duration and characteristics of past market/economic cycles and market behavior, including any bull/bear markets, is no indication of the duration and characteristics of any current or future be market/economic cycles or behavior. Information on historical observations about asset or sub-asset classes is not intended to represent or predict future events. Historical trends do not imply, forecast or guarantee future results. Information is based on current views and market conditions, which will fluctuate and may be superseded by subsequent market events or for other reasons.
Discussions of any specific sectors and companies are for informational purposes only. This material is not intended as a formal research report and should not be relied upon as a basis for making an investment decision. The firm, its employees and advisory accounts may hold positions of any companies discussed. Nothing herein constitutes a recommendation to buy, sell or hold a security. It should not be assumed that any investments in securities, companies, sectors or markets identified and described were or will be profitable. Investment decisions and the appropriateness of this content should be made based on an investor's individual objectives and circumstances and in consultation with his or her advisors.
Neuberger Investment Advisers LLC is a registered investment adviser.
The “Neuberger” name and logo are registered service marks of Neuberger Berman Group LLC.