NEWS AND INSIGHTS | MARKET COMMENTARY
Markets Wrestle With AI’s Next Phase
August 05, 2026

We remain overweight global equities on the AI buildout, favoring the U.S., Japan and China, while acknowledging opportunities in both credit and duration in an uncertain rate environment.
Buoyed by the prospect of strong earnings and the potential for a snapback for U.S. growth stocks following June’s swoon, equity investors came into July with optimism for a strong start to the third quarter. Instead, July proved choppy, as global profit-taking and a good bit of deleveraging translated into a sell-off in chipmakers at mid-month, compounding an earlier rotation from mega-cap tech into communication services and financials. Also complicating the narrative was a sharp drop in Korean equities, as the KOSPI posted its worst month on record. The index erased roughly a quarter of its value in a matter of weeks on steep declines in Samsung and SK Hynix, exacerbated by large holdings and commensurate flows out of leveraged ETFs; this further weighed on global AI sentiment.
The Federal Reserve did little to help the cause. Despite its holding rates at 3.50% – 3.75%, the real story was a hawkish split, with Beth Hammack, Neel Kashkari and Lorie Logan dissenting in favor of a hike—a clear signal that the committee is less comfortable with inflation than the headline hold implies. Chair Kevin Warsh failed to calm the waters in his press conference. While he was disciplined and direct, stressing that the Fed cannot accept higher inflation just because the last mile is proving difficult, he provided little clarity on what data the Fed would be watching to make that decision—which could be challenging given that core CPI has already been north of the Fed’s 2% for over five years, while upside risks remain: from Middle East tensions feeding energy, to tariff pass-through, to the massive AI infrastructure buildout creating a new capex impulse and firmer demand in areas that were supposed to cool.
The hawkish tone of the FOMC coupled with the lack of any guidance—forward or otherwise—from Warsh was in contrast with the June data. Core CPI was flat month-over-month and up +2.6% year-over-year, while headline CPI fell -0.4% on the month and rose +3.5% from a year earlier, both better than expected. Shelter looked a bit less threatening, goods pricing stayed soft, and some sticky services categories moderated. In addition, U.S. nonfarm payrolls rose just 57,000 in June 2026, well below the downwardly revised May gain, with professional services, social assistance and health care adding jobs while leisure and hospitality shed 61,000. The unemployment rate ticked down to 4.2%, but that drop was driven by a fall in labor force participation to 61.5%, the lowest level since March 2021, rather than genuine strength in hiring.
Equity performance was mixed, as the S&P 500 eased -0.6% while the Nasdaq and Russell 1000 Growth indexes dropped -3.2% and -5.9%, respectively. The weakness in technology stocks and the relative outperformance of financials extended to non-U.S. markets, as the MSCI Emerging Markets index fell -3.0%, while the MSCI EAFE Index, with its lower exposure to AI, was up +2.0%. Within fixed income, Treasury yields rose meaningfully across the curve in July, particularly at the long end as the 10-year climbed from 4.48% to 4.73% at the end of July. Finally, commodities were up for the month as renewed tensions in the Middle East pushed oil prices higher.
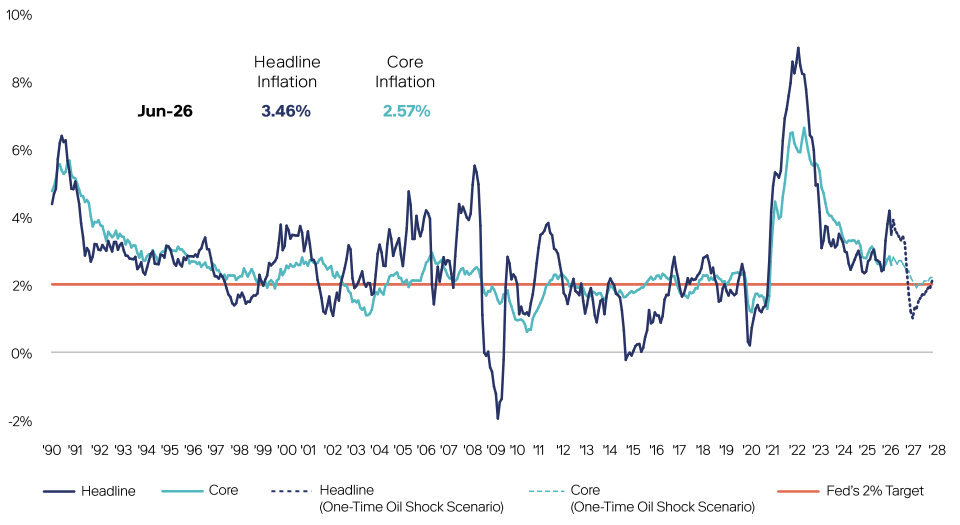
Source: Bloomberg as of June 2026. Neuberger estimates as of June 2026. Oil shock scenario uses the current gas futures curve (RBOB) to provide a sequence of forward exogenous inputs to a small model of CPI Energy Goods; the no-oil-shock scenario combines forecasts prior to the Iran conflict with a random walk forecast for oil prices.
Coming into second quarter earnings season, the question was never whether S&P 500 earnings would be good; it was how good they would be, and whether that strength could keep pushing equities higher. Investors were seeking justification to hold or add to semiconductor positions after the SOX index ripped +88% in the second quarter, its strongest showing on record. The move in memory ushered in new concerns about demand durability and AI monetization, as investors weighed how much of the potential performance in memory had been pulled forward on the back of meaningful flows.
In typical fashion for the last three years, investors turned to cloud and infrastructure providers for confirmation, and the hyperscalers delivered. Cloud revenue accelerated at its fastest pace in years, driven increasingly by non-frontier model customers, a signal that enterprise AI adoption is broadening out beyond the early movers. Capex guidance held firm or moved higher across the hyperscaler complex, reinforcing the buildout narrative. Conversely, the threat of lower margins as memory producers command pricing power weighed on device and consumer hardware names; with memory shortages likely to persist at least through 2028, that pressure may remain. In addition, companies that underwhelmed in their articulation of their ability to monetize their ongoing spending, which credit investors know all too well is cannibalizing valuable free cash flow, were also sold following their earnings releases. Without a cloud business or another way to capture the push for compute, the path to profits feels more uncertain.
Infrastructure remains an important piece of the puzzle, as well, but requires a level of investment that is unlikely to come only from one source. In evaluating the massive amount of capital expenditure aligned with AI infrastructure, investors are being forced to consider increasingly complex arrangements that involve multiple parties, including hyperscalers, chip suppliers, and private equity and debt firms. Factoring these deals into earnings expectations is likely to prove challenging as the return on investment—particularly on large campuses—is likely to accrete to an array of beneficiaries over an extended period. The other looming question centers on policy: The backlash against large-scale data centers is pronounced and will likely require more robust private-public partnership going forward to ensure that the “chassis” is strong enough to support the weight of AI opportunity.
July also reminded investors to avoid a narrow emphasis on U.S. AI opportunities and risks. As mentioned above, the massive flows into and then out of the Korean equity market were closely tied to investors seeking winners like those in the U.S. But a wave of Chinese opportunity is looming. The DeepSeek sell-off of January 2025 may have caught investors by surprise, but the advances emanating from Chinese AI labs over the last 18 months are worth attention. Chinese AI investment may share some similarities with the U.S. However, the emphasis on broader distribution and industrial effects creates a differentiated opportunity for investors; it bears watching how this more democratized approach to distribution transmits to broader economic and earnings growth.
The stakes remain high for AI in the second half of 2026. The top-10 companies in the S&P 500 now account for almost 40% of the index, and, of those 10, arguably just one—Berkshire Hathaway—is not a direct AI player. What is clear is that demand for computing power is growing, and new opportunities to align with companies benefiting from that trend are bubbling up every day. That said, the risk of disappointment is rising as well, as investors become increasingly exposed to the growth promised by AI. Diversification as a hedge and dispersion as a reality are the two mantras we believe will remain critical for investors, even as we also believe in the long-term potential.
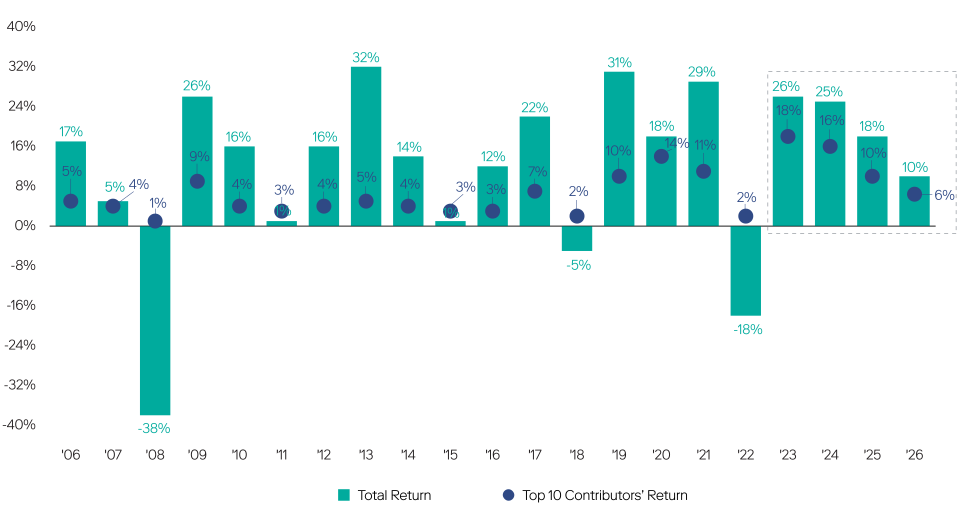
Source: Bloomberg, as of July 2026.
Equities. We remain overweight global equities, driven by the AI capital expenditure cycle, strong earnings and a nascent manufacturing recovery gaining momentum into year-end. We downgraded Europe to underweight on energy vulnerability and slowing growth, while India moved to neutral given rising real rates and weakening foreign flows. Japan, China and broader emerging markets stayed at overweight, as structural reform, AI momentum and a weaker dollar remain tailwinds.
Fixed Income. Rising real rates, not inflation, are the dominant force in fixed income. We are at-target to U.S. Treasuries, with a preference for the short end of the yield curve. Credit fundamentals are intact, and we are constructive on U.S. investment grade and high yield corporates despite tight spreads. Outside of the U.S., we maintained our overweight of European fixed income due to slowing growth, while emerging market debt has become more attractive.
Private Markets. Private equity and credit remain at target weight, with secondaries and co-investments offering compelling entry points given the continued need for liquidity. Commodities are a modest overweight as a diversifier and inflation buffer, with El Niño introducing additional potential upside in agricultural commodities. We upgraded hedged strategies to overweight, favoring absolute-return and macro approaches as traditional equity-bond diversification proves less effective.
| Jul-26 | 3M | YTD | |
|---|---|---|---|
| Equities | |||
| Major U.S. Indices | |||
| S&P 500 Index | -0.06% | 4.19% | 10.14% |
| Nasdaq Composite | -3.19% | 2.09% | 9.53% |
| Dow Jones | 0.38% | 6.13% | 10.17% |
| U.S. Size Indices | |||
| Large Cap | -0.35% | 4.20% | 9.93% |
| Mid Cap | -0.62% | 5.39% | 14.59% |
| Small Cap | -3.03% | 4.99% | 18.85% |
| All Cap | -0.47% | 4.26% | 10.35% |
| U.S. Style Indices | |||
| All Cap Growth | -4.81% | -0.70% | 0.79% |
| All Cap Value | 3.64% | 9.19% | 20.80% |
| Global Equity Indices | |||
| ACWI | 0.08% | 4.40% | 11.33% |
| ACWI ex US | 0.34% | 4.77% | 14.08% |
| DM Non-U.S. Equities | 1.97% | 5.30% | 12.00% |
| EM Equities | -3.03% | 4.93% | 20.27% |
| Portfolios | |||
| 50/50 Portfolio | -0.96% | 1.83% | 5.28% |
| Jul-26 | 3M | YTD | |
|---|---|---|---|
| Fixed Income Currencies & Commodities | |||
| Major U.S. Indices | |||
| Cash | 0.33% | 0.92% | 2.08% |
| U.S. Aggregate | -1.30% | -0.76% | -0.69% |
| Munis | -1.85% | -0.54% | 0.43% |
| U.S. Corporates | |||
| Investment Grade | -1.67% | -0.75% | -0.83% |
| High Yield | -0.22% | 0.67% | 1.82% |
| Short Duration (1.9 Yrs) | 0.15% | 0.40% | 0.96% |
| Long Duration (12.8 Yrs) | -3.94% | -2.33% | -3.21% |
| Global Fixed Income Indices | |||
| Global Aggregate | -0.53% | -0.90% | -0.75% |
| EMD Corporates | -0.50% | 0.22% | 1.60% |
| Commodities | |||
| Commodities | 7.54% | -5.14% | 22.98% |
| U.S. Treasury Yields | |||
| U.S. 10-Year Yield | 0.27% | 0.36% | 0.57% |
| U.S. 2-Year Yield | 0.12% | 0.42% | 0.82% |
| FX | |||
| U.S. Dollar | -1.26% | 1.89% | 1.62% |
Source: Bloomberg, Total returns as of July 31st,2026. S&P 500 Index is represented by S&P 500 Total Return Index. Nasdaq Composite NASDAQ-Composite Total Return Index. Dow Jones is represented by Dow Jones Industrial Average TR. Large Cap is represented by Russell 1000 Total Return Index. Mid Cap is represented by Russell Midcap Index Total Return. Small Cap is represented by Russell 2000 Total Return Index. All Cap is represented by Russell 3000 Total Return Index. Large Cap Growth is represented by Russell 1000 Growth Total Return. Large Cap Value is represented by Russell 1000 Value Index Total Return. Small Cap Growth is represented by Russell 2000 Growth Total Return. Small Cap Value is represented by Russell 2000 Value Total Return. ACWI is represented by MSCI ACWI Net Total Return USD Index. ACWI ex US is represented by MSCI ACWI ex USA Net Total Return USD Index. DM Non-U.S. Equities is represented by MSCI Daily TR Gross EAFE USD. EM Equities is represented by MSCI Daily TR Gross EM USD. Cash is represented by ICE BofA US 3-Month Treasury Bill Index. U.S. Aggregate is represented by Bloomberg US Agg Total Return Value Unhedged USD. Munis is represented by Bloomberg Municipal Bond Index Total Return Index Value Unhedged USD. Munis Short Duration is represented by Bloomberg Municipal Bond: Muni Short (1-5) Total Return Unhedged USD. Munis Intermediate Duration is represented by Bloomberg Municipal Bond: Muni Intermediate (5-10) TR Unhedged USD. Investment Grade is represented by Bloomberg US Corporate Total Return Value Unhedged USD. High Yield is represented by Bloomberg US High Yield BB/B 2% Issuer Cap Total Return Index Value Unhedged USD. Short Duration is represented by Bloomberg US Agg 1-3 Year Total Return Value Unhedged USD. Long Duration is represented by Bloomberg US Agg 10+ Year Total Return Value Unhedged USD. Global Aggregate is represented by Bloomberg Global-Aggregate Total Return Index Value Unhedged USD. EMD Corporates is represented by J.P. Morgan Corporate EMBI Diversified Composite Index Level. EMD Sovereigns – USD is represented by J.P. Morgan EMBI Global Diversified Composite. Commodities is represented by Bloomberg Commodity Index Total Return. Commodities ex Energy is represented by Bloomberg Ex-Energy Subindex Total Return. U.S. 10-Year Yield is represented by US Generic Govt 10 Yr.
IMPORTANT INFORMATION:
This material is provided for informational and educational purposes only and nothing herein constitutes investment, legal, accounting or tax advice, or a recommendation to buy, sell or hold a security. This material is general in nature and is not directed to any category of investors and should not be regarded as individualized, a recommendation, investment advice or a suggestion to engage in or refrain from any investment-related course of action. Neither Neuberger nor its employees provide tax or legal advice. All information is current as of the date of this material and is subject to change without notice. The firm, its employees and advisory accounts may hold positions of any companies discussed. Any views or opinions expressed may not reflect those of the firm as a whole. Neuberger products and services may not be available in all jurisdictions or to all client types. Diversification does not guarantee profit or protect against loss in declining markets. Investments in private equity are speculative and involve a higher degree of risk than more traditional investments. Investments in private equity are intended for sophisticated investors only. Unless otherwise indicated, returns shown reflect reinvestment of dividends and distributions. Indexes are unmanaged and are not available for direct investment. Investing entails risks, including possible loss of principal. Past performance is no guarantee of future results.
Portfolio positioning views expressed herein are those of Neuberger Wealth Investment Group which may include those of the Neuberger’s Asset Allocation Committee. Asset allocation and positioning views are based on a hypothetical reference portfolio. The Neuberger Wealth Investment Group analyzes market and economic indicators to develop asset allocation strategies. The Neuberger Wealth Investment Group works in partnership with the Office of the CIO. The Neuberger Wealth Investment Group also consults regularly with portfolio managers and investment officers across the firm. The Asset Allocation Committee is comprised of professionals across multiple disciplines, including equity and fixed income strategists and portfolio managers. The Asset Allocation Committee reviews and sets long-term asset allocation models, establishes preferred near-term tactical asset class allocations and, upon request, reviews asset allocations for large diversified mandates. Asset Allocation Committee members are polled on asset classes and the positional views are representative of an Asset Allocation Committee consensus. The views of the Asset Allocation Committee and the Neuberger Wealth Investment Group may not reflect the views of the firm as a whole and Neuberger advisers and portfolio managers may take contrary positions to the views of the Asset Allocation Committee or the Neuberger Wealth Investment Group. The Asset Allocation Committee and the Neuberger Wealth Investment Group views do not constitute a prediction or projection of future events or future market behavior. Defensive positioning generally means an underweight bias on allocations to risk assets such as equities and alternatives. Positioning views may change over time without notice and actual client positioning may vary significantly. Discussion of yield characteristics or total returns of different asset classes are for illustrative purposes only. Such asset classes, such as equities and fixed income, may have significantly different overall risk-return characteristics which should be consider before investing.
The information in this material may contain projections, market outlooks or other forward-looking statements regarding future events, including economic, asset class and market outlooks or expectations, and is only current as of the date indicated. There is no assurance that such events, outlook and expectations will be achieved, and actual results may be significantly different than that shown here. The duration and characteristics of past market/economic cycles and market behavior, including any bull/bear markets, is no indication of the duration and characteristics of any current or future be market/economic cycles or behavior. Information on historical observations about asset or sub-asset classes is not intended to represent or predict future events. Historical trends do not imply, forecast or guarantee future results. Information is based on current views and market conditions, which will fluctuate and may be superseded by subsequent market events or for other reasons.
Discussions of any specific sectors and companies are for informational purposes only. This material is not intended as a formal research report and should not be relied upon as a basis for making an investment decision. The firm, its employees and advisory accounts may hold positions of any companies discussed. Nothing herein constitutes a recommendation to buy, sell or hold a security. It should not be assumed that any investments in securities, companies, sectors or markets identified and described were or will be profitable. Investment decisions and the appropriateness of this content should be made based on an investor's individual objectives and circumstances and in consultation with his or her advisors.
Neuberger Investment Advisers LLC is a registered investment adviser.
The “Neuberger” name and logo are registered service marks of Neuberger Berman Group LLC.