NEWS AND INSIGHTS | MARKET COMMENTARY
Technology Provides a Port in the Storm
October 07, 2026

We are overweight U.S. large caps, Japan, China and semiconductor-linked emerging markets, keeping duration a bit shorter and credit near target, and leaning into commodities, hedged strategies and private real estate for diversification.
September, on average, is the most volatile month of the year—and 2026 provided no exception. The setup going into September was difficult for broad markets even without the overhang of seasonality, as the combination of a quiet corporate reporting environment and a strongly hawkish tilt to central bank positioning threatened to upset the continued strength of the global equity markets.
U.S. data was strong in the month of September, reflecting the underlying momentum of the U.S. economy and increasingly disruptive supply shocks. August nonfarm payrolls came in well above consensus, +162k versus the +55k consensus; June and July were also revised higher by a combined +55k. The strength was broad, led by leisure and hospitality, local government education and manufacturing, while information jobs were lost on the back of AI disruption. Even more encouraging was the increase in the labor participation rate to 61.6%.
From there, attention turned to the August CPI release, which showed inflation still running above target, with headline CPI up 0.4% month-over-month and 3.4% year-over-year, and core CPI up 0.3% on the month and 2.4% annually. Combined with a labor market that continued to show underlying strength, this data appeared to tip the scales for a hike—and set in motion the Federal Reserve’s first hiking cycle since 2023. The Fed raised the federal funds target range by 25 basis points to 3.75 – 4.00% in a unanimous vote, but perhaps more importantly, reflected a shift in terms of the emphasis on getting inflation back to the 2% target. In addition, the Fed, via Chair Kevin Warsh, used the September press conference to paint the picture of an accelerating, not weakening, U.S. economy, implying that there may need to be further hikes to offset the combination of energy price- and AI buildout-related inflation.
In our view, the pressure on yields is therefore unlikely to abate. Central banks globally are hiking rates; in addition to the Fed, the European Central Bank and the Bank of Japan also moved in September, and while the Bank of England and Bank of Canada remain on hold, the overall tone hardly feels dovish. Global growth is strong and potentially poised to strengthen as the capital expenditure from the AI buildout broadens both geographically and to other sectors and industries.
For the period, higher yields and greater uncertainty translated into pressure on the “broadening trade.” The S&P 500 closed the month down -0.4%, while the equal-weight S&P 500 lost -4.9% for the month as breadth faded away; only the technology and telecommunication services sectors posted gains in September. U.S. small caps, too, languished on the threat of higher rates, with the Russell 2000 down -5.3%. European and Japanese names traded lower on the month as well, and emerging markets equities, which had been a bright spot in large part due to the concentrated strong performance in Korean equities, closed down -0.5%.
While equities were weaker, the real pain was felt in the bond market. The 10-year Treasury yield rose roughly 0.5% to close the month just shy of 5.3%, a level not seen since 2002, while the 30-year closed above 5.6%. Other sovereigns were not immune to the sell-off either, as German 10-year Bund yields crested to 3.6%, and U.K. gilts traded above 5.4%. Commodities, often employed as a hedge during inflationary periods and/or as a diversifier during periods of correlation, continued to perform well in September as energy prices remained high.
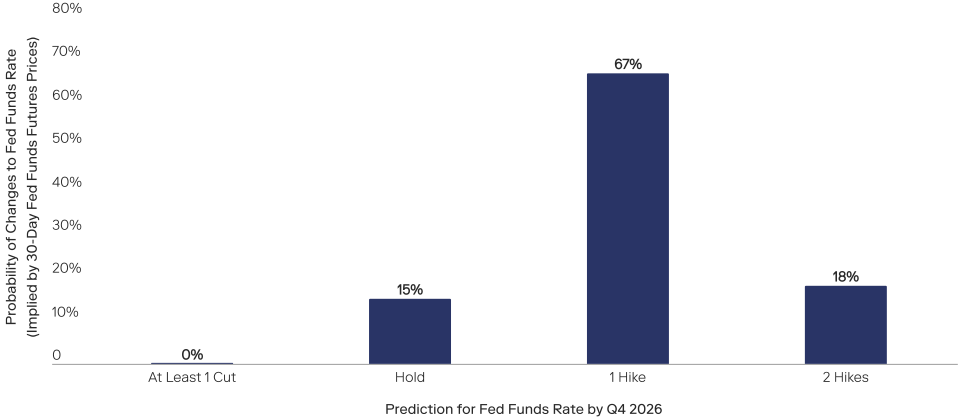
Source: CME Group Fed Watch as of October 2nd, 2026.
Back in March, we hypothesized that, should the conflict in the Middle East persist through the summer months, U.S. consumers would be hard-pressed to digest elevated energy prices following five years of accelerating costs. Both consumer confidence and spending had trended lower through the fourth quarter of 2025, and the threat of a retrenched U.S. consumer to global growth was one that was hard to ignore. We also noted the challenging backdrop in terms of the timing of the conflict, with U.S. midterm elections looming in November.
Fast forward to today, and we have weathered seven months of energy price volatility stemming from the continued conflict between the U.S. and Iran, and in particular, the inconsistent supply of oil and other goods through the Strait of Hormuz. Inflation is on the rise, with higher energy prices compounding AI-related supply-demand mismatches, and consumer confidence trending lower. More recently, higher rates have created another burden for U.S. consumers, and affordability is clearly the primary concern for most Americans heading into November midterm elections. Wages, too, are no longer keeping pace with inflation. Wage growth has moderated to 3.1% from 3.7% at the beginning of the year, compared with headline CPI of 3.4%. The benefits of higher tax refunds and lower tax withholding enjoyed in March and April are now also behind us, and with the savings rate running at only 3.0%, historical comparisons would point to a consumer that should be retrenching.
The data is telling a different story, however. Retail sales for August were up +1.2% month-over-month, with the control group—which excludes autos, gasoline, building materials and food services—also up +1.4%, its strongest print since 2024. The broad-based strength in retail sales is being driven, too, by a larger percentage of the population, as the spending gap between high-income and low-income households is narrowing—perhaps because of accelerating wages in the low-income cohort. Credit card delinquencies, cited as evidence of stress, particularly for lower income households, have showed improvement in 90+ day delinquencies for that group since the peak in 2025, and overall, a 30+ day delinquency rate running at less than 3% indicates that the consumer still has breathing room.
How have consumers managed to overcome the affordability challenge? One need look no further than the equity market. U.S. consumers are 1.7 times more exposed to U.S. equities than they were prior to the Global Financial Crisis, and financial assets account for almost 70% of all U.S. household assets. The wealth effect, historically correlated with the U.S. housing market, is now dominated by a household’s exposure to the U.S. equity market. With four years of strong equity market gains, consumers are feeling more comfortable spending, as retirement savings are growing at a pace well above contributions. In addition, with consumer asset-to-liability ratios running well south of any level experienced in the last three decades, it is not altogether surprising that consumers have weathered this most recent challenge.
The headwinds, however, are strengthening. The residual benefits from the One Big Beautiful Bill Act are behind us, and the savings rate is likely close to a cycle low. Energy price pass-through, which we anticipated would be limited, is now a real threat as companies are forced to contemplate ways to protect their margins given elevated gasoline, jet fuel and diesel prices. Borrowing rates have risen meaningfully over the last several months, as the 10-year Treasury yield started the year slightly above 4% and now trades over 5.2% at the time of this writing. While the largest liability for many U.S. consumers is a 30-year rate fixed mortgage, adjustable-rate housing debt has been an attractive option more recently as interest rates were expected to move lower, not higher, as the inflationary impacts from COVID and tariffs were showing signs of moderation.
Capital expenditure has been driving U.S. growth over the last 18 months, and consumer resilience has been a welcome contributor. Should capital expenditure slow based on concerns about the sustainability of the AI trade, however, the U.S. economy could suffer a one-two punch given the exposure of the U.S. consumer to the capital markets—resulting in a mid-cycle slowdown. While this is not our current base case, it is one of the factors that investors need to be cognizant of as the potential risks and opportunities of the AI buildout continue to drive both the economy and capital markets.
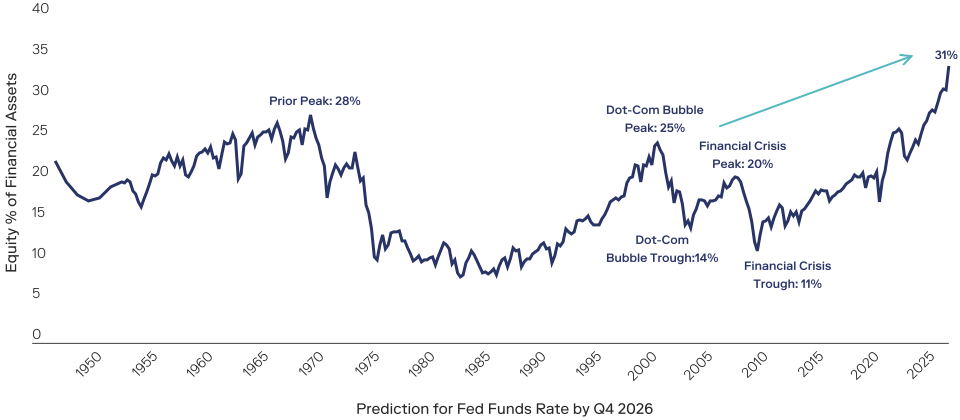
Source: Bloomberg as of March 31st, 2026. Federal Reserve FOF Household and NPO Balance Sheet data. Equity is only directly held equities, so full equity exposure (within other wrappers) may be larger.
Equities. We maintain an overweight to U.S. large-cap equities but have moved small and midcaps to at target. Outside of the U.S., we favor Japan, China and semiconductor-linked emerging markets exposure. While we acknowledge the recent strength in European equity earnings, we see current valuations as demanding, particularly given the underwhelming expectations for economic growth.
Fixed Income. We recommend a modestly shorter duration posture and holding credit close to target levels. Within multi-sector portfolios, we are trimming U.S. government securities, agency MBS, and non-U.S. developed markets. As it relates to high yield, we are maintaining a higher-quality tilt.
Private Markets. We have increased our overweight to commodities and maintained our hedged strategies overweight as a hedge against uncertain equity beta. Private equity and private debt stay at target. Private real estate remains an overweight thanks to its stronger diversification profile.
| Sep-26 | 3M | YTD | |
|---|---|---|---|
| Equities | |||
| Major U.S. Indices | |||
| S&P 500 Index | -0.35% | 2.30% | 12.75% |
| Nasdaq Composite | 1.93% | 2.61% | 16.09% |
| Dow Jones | -4.12% | -2.34% | 7.19% |
| U.S. Size Indices | |||
| Large Cap | -0.65% | 1.80% | 12.30% |
| Mid Cap | -4.17% | -3.00% | 11.84% |
| Small Cap | -5.25% | -7.23% | 13.71% |
| All Cap | -0.84% | 1.41% | 12.42% |
| U.S. Style Indices | |||
| All Cap Growth | 1.83% | 0.45% | 6.36% |
| All Cap Value | -3.21% | 2.31% | 19.22% |
| Global Equity Indices | |||
| ACWI | -1.11% | 1.60% | 13.03% |
| ACWI ex US | -2.38% | 0.48% | 14.22% |
| DM Non-U.S. Equities | -3.01% | 0.88% | 10.81% |
| EM Equities | -0.50% | -0.24% | 23.73% |
| Portfolios | |||
| 50/50 Portfolio | -2.35% | -2.02% | 4.28% |
| Sep-26 | 3M | YTD | |
|---|---|---|---|
| Fixed Income Currencies & Commodities | |||
| Major U.S. Indices | |||
| Cash | 0.27% | 0.89% | 2.65% |
| U.S. Aggregate | -2.61% | -3.51% | -2.91% |
| Munis | -4.36% | -6.35% | -4.18% |
| U.S. Corporates | |||
| Investment Grade | -2.72% | -3.94% | -3.11% |
| High Yield | -2.42% | -1.65% | 0.36% |
| Short Duration (1.9 Yrs) | -0.58% | -0.17% | 0.64% |
| Long Duration (12.8 Yrs) | -4.75% | -7.75% | -7.04% |
| Global Fixed Income Indices | |||
| Global Aggregate | -2.38% | -2.46% | -2.67% |
| EMD Corporates | -2.06% | -1.95% | 0.12% |
| Commodities | |||
| Commodities | 0.61% | 16.19% | 32.87% |
| U.S. Treasury Yields | |||
| U.S. 10-Year Yield | 0.53% | 0.82% | 1.12% |
| U.S. 2-Year Yield | 0.55% | 0.71% | 1.41% |
| FX | |||
| U.S. Dollar | 2.03% | 0.26% | 3.18% |
Source: Bloomberg, Total returns as of September 31st,2026. S&P 500 Index is represented by S&P 500 Total Return Index. Nasdaq Composite NASDAQ-Composite Total Return Index. Dow Jones is represented by Dow Jones Industrial Average TR. Large Cap is represented by Russell 1000 Total Return Index. Mid Cap is represented by Russell Midcap Index Total Return. Small Cap is represented by Russell 2000 Total Return Index. All Cap is represented by Russell 3000 Total Return Index. Large Cap Growth is represented by Russell 1000 Growth Total Return. Large Cap Value is represented by Russell 1000 Value Index Total Return. Small Cap Growth is represented by Russell 2000 Growth Total Return. Small Cap Value is represented by Russell 2000 Value Total Return. ACWI is represented by MSCI ACWI Net Total Return USD Index. ACWI ex US is represented by MSCI ACWI ex USA Net Total Return USD Index. DM Non-U.S. Equities is represented by MSCI Daily TR Gross EAFE USD. EM Equities is represented by MSCI Daily TR Gross EM USD. Cash is represented by ICE BofA US 3-Month Treasury Bill Index. U.S. Aggregate is represented by Bloomberg US Agg Total Return Value Unhedged USD. Munis is represented by Bloomberg Municipal Bond Index Total Return Index Value Unhedged USD. Munis Short Duration is represented by Bloomberg Municipal Bond: Muni Short (1-5) Total Return Unhedged USD. Munis Intermediate Duration is represented by Bloomberg Municipal Bond: Muni Intermediate (5-10) TR Unhedged USD. Investment Grade is represented by Bloomberg US Corporate Total Return Value Unhedged USD. High Yield is represented by Bloomberg US High Yield BB/B 2% Issuer Cap Total Return Index Value Unhedged USD. Short Duration is represented by Bloomberg US Agg 1-3 Year Total Return Value Unhedged USD. Long Duration is represented by Bloomberg US Agg 10+ Year Total Return Value Unhedged USD. Global Aggregate is represented by Bloomberg Global-Aggregate Total Return Index Value Unhedged USD. EMD Corporates is represented by J.P. Morgan Corporate EMBI Diversified Composite Index Level. EMD Sovereigns – USD is represented by J.P. Morgan EMBI Global Diversified Composite. Commodities is represented by Bloomberg Commodity Index Total Return. Commodities ex Energy is represented by Bloomberg Ex-Energy Subindex Total Return. U.S. 10-Year Yield is represented by US Generic Govt 10 Yr.
IMPORTANT INFORMATION:
This material is provided for informational and educational purposes only and nothing herein constitutes investment, legal, accounting or tax advice, or a recommendation to buy, sell or hold a security. This material is general in nature and is not directed to any category of investors and should not be regarded as individualized, a recommendation, investment advice or a suggestion to engage in or refrain from any investment-related course of action. Neither Neuberger nor its employees provide tax or legal advice. All information is current as of the date of this material and is subject to change without notice. The firm, its employees and advisory accounts may hold positions of any companies discussed. Any views or opinions expressed may not reflect those of the firm as a whole. Neuberger products and services may not be available in all jurisdictions or to all client types. Diversification does not guarantee profit or protect against loss in declining markets. Investments in private equity are speculative and involve a higher degree of risk than more traditional investments. Investments in private equity are intended for sophisticated investors only. Unless otherwise indicated, returns shown reflect reinvestment of dividends and distributions. Indexes are unmanaged and are not available for direct investment. Investing entails risks, including possible loss of principal. Past performance is no guarantee of future results.
Portfolio positioning views expressed herein are those of Neuberger Wealth Investment Group which may include those of the Neuberger’s Asset Allocation Committee. Asset allocation and positioning views are based on a hypothetical reference portfolio. The Neuberger Wealth Investment Group analyzes market and economic indicators to develop asset allocation strategies. The Neuberger Wealth Investment Group works in partnership with the Office of the CIO. The Neuberger Wealth Investment Group also consults regularly with portfolio managers and investment officers across the firm. The Asset Allocation Committee is comprised of professionals across multiple disciplines, including equity and fixed income strategists and portfolio managers. The Asset Allocation Committee reviews and sets long-term asset allocation models, establishes preferred near-term tactical asset class allocations and, upon request, reviews asset allocations for large diversified mandates. Asset Allocation Committee members are polled on asset classes and the positional views are representative of an Asset Allocation Committee consensus. The views of the Asset Allocation Committee and the Neuberger Wealth Investment Group may not reflect the views of the firm as a whole and Neuberger advisers and portfolio managers may take contrary positions to the views of the Asset Allocation Committee or the Neuberger Wealth Investment Group. The Asset Allocation Committee and the Neuberger Wealth Investment Group views do not constitute a prediction or projection of future events or future market behavior. Defensive positioning generally means an underweight bias on allocations to risk assets such as equities and alternatives. Positioning views may change over time without notice and actual client positioning may vary significantly. Discussion of yield characteristics or total returns of different asset classes are for illustrative purposes only. Such asset classes, such as equities and fixed income, may have significantly different overall risk-return characteristics which should be consider before investing.
The information in this material may contain projections, market outlooks or other forward-looking statements regarding future events, including economic, asset class and market outlooks or expectations, and is only current as of the date indicated. There is no assurance that such events, outlook and expectations will be achieved, and actual results may be significantly different than that shown here. The duration and characteristics of past market/economic cycles and market behavior, including any bull/bear markets, is no indication of the duration and characteristics of any current or future be market/economic cycles or behavior. Information on historical observations about asset or sub-asset classes is not intended to represent or predict future events. Historical trends do not imply, forecast or guarantee future results. Information is based on current views and market conditions, which will fluctuate and may be superseded by subsequent market events or for other reasons.
Discussions of any specific sectors and companies are for informational purposes only. This material is not intended as a formal research report and should not be relied upon as a basis for making an investment decision. The firm, its employees and advisory accounts may hold positions of any companies discussed. Nothing herein constitutes a recommendation to buy, sell or hold a security. It should not be assumed that any investments in securities, companies, sectors or markets identified and described were or will be profitable. Investment decisions and the appropriateness of this content should be made based on an investor's individual objectives and circumstances and in consultation with his or her advisors.
Neuberger Investment Advisers LLC is a registered investment adviser.
The “Neuberger” name and logo are registered service marks of Neuberger Berman Group LLC.